OxfordIndustries OXM full analysis,charts,indicators,moving averages,SMA,DMA,EMA,ADX,MACD,RSIOxford Industries OXM WideScreen charts, DMA,SMA,EMA technical analysis, forecast prediction, by indicators ADX,MACD,RSI,CCI NYSE stock exchange
operates under Consumer Non Durables sector & deals in Apparel
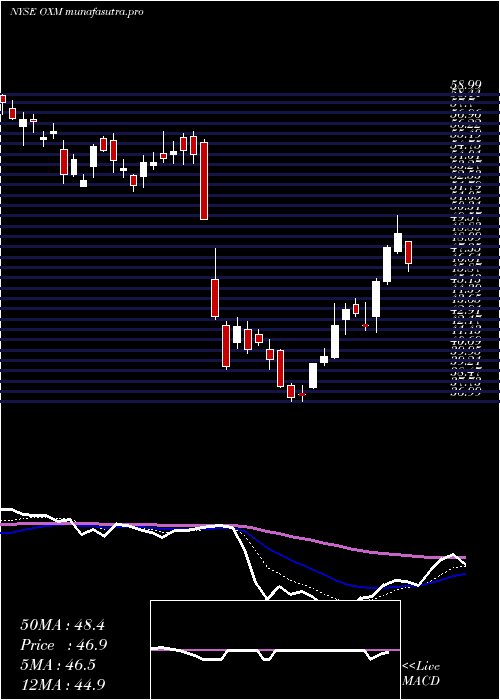
Daily price and charts and targets OxfordIndustries Strong Daily Stock price targets for OxfordIndustries OXM are 38.63 and 40.13 | Daily Target 1 | 38.24 | | Daily Target 2 | 39.01 | | Daily Target 3 | 39.74 | | Daily Target 4 | 40.51 | | Daily Target 5 | 41.24 |
Daily price and volume Oxford Industries
| Date |
Closing |
Open |
Range |
Volume |
Thu 04 December 2025 |
39.78 (-2.48%) |
40.30 |
38.97 - 40.47 |
1.0695 times |
Wed 03 December 2025 |
40.79 (0.74%) |
40.62 |
40.62 - 42.07 |
1.816 times |
Tue 02 December 2025 |
40.49 (3.16%) |
39.45 |
38.71 - 40.74 |
0.7597 times |
Mon 01 December 2025 |
39.25 (2.86%) |
37.65 |
37.39 - 40.06 |
0.8328 times |
Fri 28 November 2025 |
38.16 (0.85%) |
37.64 |
37.34 - 38.34 |
0.3177 times |
Wed 26 November 2025 |
37.84 (2.27%) |
37.27 |
37.23 - 38.57 |
0.7629 times |
Tue 25 November 2025 |
37.00 (9.4%) |
35.05 |
34.51 - 37.18 |
1.0851 times |
Mon 24 November 2025 |
33.82 (0.8%) |
33.18 |
32.84 - 34.10 |
1.293 times |
Fri 21 November 2025 |
33.55 (4.84%) |
32.56 |
31.98 - 34.33 |
0.9151 times |
Thu 20 November 2025 |
32.00 (0.82%) |
32.13 |
31.47 - 32.63 |
1.1482 times |
Wed 19 November 2025 |
31.74 (-5.59%) |
33.69 |
31.62 - 33.91 |
0.8568 times |
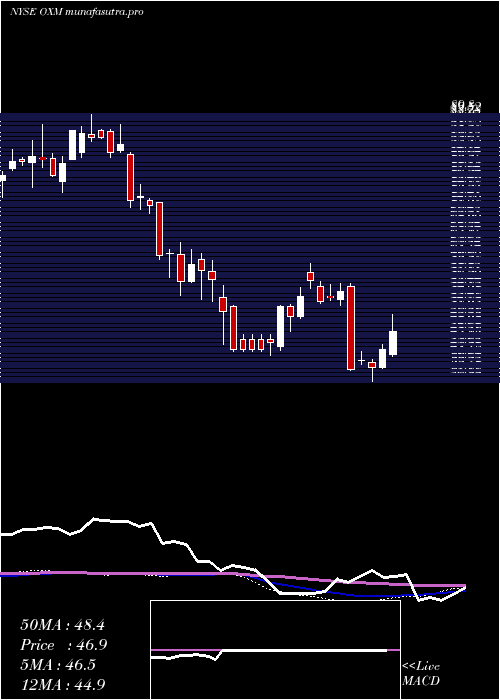
Weekly price and charts OxfordIndustries Strong weekly Stock price targets for OxfordIndustries OXM are 38.59 and 43.27 | Weekly Target 1 | 35.07 | | Weekly Target 2 | 37.42 | | Weekly Target 3 | 39.746666666667 | | Weekly Target 4 | 42.1 | | Weekly Target 5 | 44.43 |
Weekly price and volumes for Oxford Industries
| Date |
Closing |
Open |
Range |
Volume |
Thu 04 December 2025 |
39.78 (4.25%) |
37.65 |
37.39 - 42.07 |
1.294 times |
Fri 28 November 2025 |
38.16 (13.74%) |
33.18 |
32.84 - 38.57 |
0.9994 times |
Fri 21 November 2025 |
33.55 (-4.17%) |
34.68 |
31.47 - 34.99 |
1.3947 times |
Fri 14 November 2025 |
35.01 (-5.68%) |
37.47 |
34.65 - 37.62 |
1.1279 times |
Fri 07 November 2025 |
37.12 (0.73%) |
36.62 |
35.72 - 38.44 |
0.79 times |
Fri 31 October 2025 |
36.85 (0%) |
36.16 |
35.53 - 36.91 |
0.2016 times |
Fri 31 October 2025 |
36.85 (-9.21%) |
40.96 |
35.53 - 41.39 |
1.1356 times |
Fri 24 October 2025 |
40.59 (6.9%) |
38.09 |
37.52 - 40.66 |
1.3148 times |
Fri 17 October 2025 |
37.97 (-1.53%) |
36.49 |
36.26 - 38.41 |
1.2525 times |
Tue 07 October 2025 |
38.56 (-5.09%) |
40.70 |
38.16 - 40.85 |
0.4896 times |
Fri 03 October 2025 |
40.63 (-3.47%) |
42.50 |
39.48 - 42.71 |
0.9972 times |
Monthly price and charts OxfordIndustries Strong monthly Stock price targets for OxfordIndustries OXM are 38.59 and 43.27 | Monthly Target 1 | 35.07 | | Monthly Target 2 | 37.42 | | Monthly Target 3 | 39.746666666667 | | Monthly Target 4 | 42.1 | | Monthly Target 5 | 44.43 |
Monthly price and volumes Oxford Industries
| Date |
Closing |
Open |
Range |
Volume |
Thu 04 December 2025 |
39.78 (4.25%) |
37.65 |
37.39 - 42.07 |
0.2336 times |
Fri 28 November 2025 |
38.16 (3.55%) |
36.62 |
31.47 - 38.57 |
0.7785 times |
Fri 31 October 2025 |
36.85 (-9.1%) |
40.71 |
35.53 - 41.96 |
0.8967 times |
Tue 30 September 2025 |
40.54 (-7.97%) |
43.41 |
39.70 - 51.61 |
1.4751 times |
Fri 29 August 2025 |
44.05 (15.37%) |
37.41 |
36.25 - 47.89 |
0.769 times |
Thu 31 July 2025 |
38.18 (-5.14%) |
40.13 |
37.43 - 50.36 |
1.0347 times |
Mon 30 June 2025 |
40.25 (-25.02%) |
53.24 |
36.99 - 56.39 |
1.3526 times |
Fri 30 May 2025 |
53.68 (10.45%) |
48.96 |
47.67 - 60.31 |
0.9154 times |
Wed 30 April 2025 |
48.60 (-17.16%) |
59.35 |
42.12 - 61.02 |
1.2658 times |
Mon 31 March 2025 |
58.67 (-5.42%) |
62.26 |
53.23 - 64.55 |
1.2784 times |
Fri 28 February 2025 |
62.03 (-26.03%) |
81.96 |
61.10 - 82.24 |
0.6802 times |
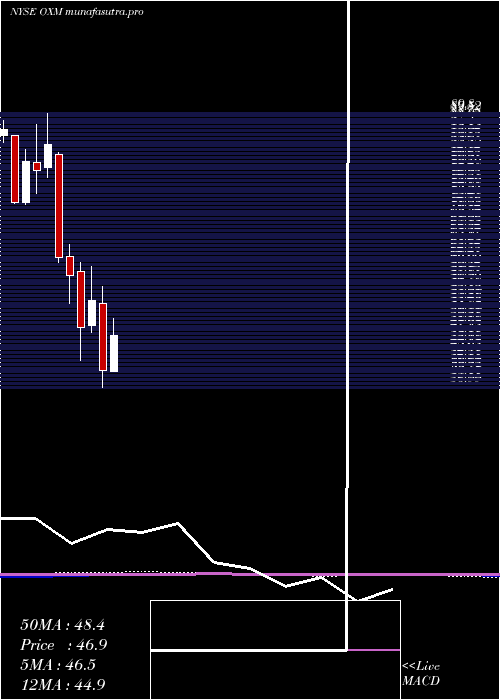
DMA SMA EMA moving averages of Oxford Industries OXM
DMA (daily moving average) of Oxford Industries OXM
| DMA period | DMA value | | 5 day DMA | 39.69 | | 12 day DMA | 36.5 | | 20 day DMA | 36.25 | | 35 day DMA | 37.15 | | 50 day DMA | 38.09 | | 100 day DMA | 40.76 | | 150 day DMA | 43.68 | | 200 day DMA | 47.1 | EMA (exponential moving average) of Oxford Industries OXM
| EMA period | EMA current | EMA prev | EMA prev2 | | 5 day EMA | 39.41 | 39.23 | 38.45 | | 12 day EMA | 37.85 | 37.5 | 36.9 | | 20 day EMA | 37.38 | 37.13 | 36.74 | | 35 day EMA | 37.85 | 37.74 | 37.56 | | 50 day EMA | 38.9 | 38.86 | 38.78 |
SMA (simple moving average) of Oxford Industries OXM
| SMA period | SMA current | SMA prev | SMA prev2 | | 5 day SMA | 39.69 | 39.31 | 38.55 | | 12 day SMA | 36.5 | 36.01 | 35.52 | | 20 day SMA | 36.25 | 36.16 | 35.95 | | 35 day SMA | 37.15 | 37.08 | 36.99 | | 50 day SMA | 38.09 | 38.19 | 38.28 | | 100 day SMA | 40.76 | 40.86 | 40.93 | | 150 day SMA | 43.68 | 43.76 | 43.83 | | 200 day SMA | 47.1 | 47.28 | 47.44 |
|
|
