OshkoshCorporation OSK full analysis,charts,indicators,moving averages,SMA,DMA,EMA,ADX,MACD,RSIOshkosh Corporation OSK WideScreen charts, DMA,SMA,EMA technical analysis, forecast prediction, by indicators ADX,MACD,RSI,CCI NYSE stock exchange
operates under Capital Goods sector & deals in Auto Manufacturing
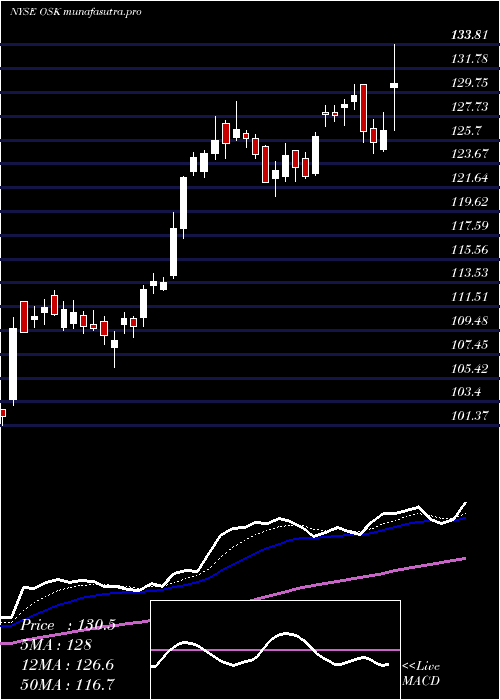
Daily price and charts and targets OshkoshCorporation Strong Daily Stock price targets for OshkoshCorporation OSK are 128.05 and 130.58 | Daily Target 1 | 127.58 | | Daily Target 2 | 128.51 | | Daily Target 3 | 130.11333333333 | | Daily Target 4 | 131.04 | | Daily Target 5 | 132.64 |
Daily price and volume Oshkosh Corporation
| Date |
Closing |
Open |
Range |
Volume |
Fri 05 December 2025 |
129.43 (-1.14%) |
131.00 |
129.19 - 131.72 |
1.1346 times |
Thu 04 December 2025 |
130.92 (2.16%) |
128.71 |
127.64 - 130.94 |
0.722 times |
Wed 03 December 2025 |
128.15 (2.72%) |
125.43 |
124.50 - 128.68 |
1.3461 times |
Tue 02 December 2025 |
124.76 (-1.96%) |
127.95 |
123.56 - 129.62 |
1.3397 times |
Mon 01 December 2025 |
127.26 (-0.72%) |
126.23 |
126.23 - 128.77 |
1.2159 times |
Fri 28 November 2025 |
128.18 (0.83%) |
127.67 |
126.50 - 128.97 |
0.3069 times |
Wed 26 November 2025 |
127.12 (-0.44%) |
127.52 |
126.46 - 128.30 |
0.8458 times |
Tue 25 November 2025 |
127.68 (1.96%) |
127.17 |
124.79 - 128.03 |
0.9212 times |
Mon 24 November 2025 |
125.23 (1.88%) |
123.98 |
122.72 - 126.56 |
1.1847 times |
Fri 21 November 2025 |
122.92 (3.65%) |
118.90 |
118.90 - 124.78 |
0.9832 times |
Thu 20 November 2025 |
118.59 (-2.5%) |
123.38 |
118.49 - 125.01 |
1.0499 times |
Weekly price and charts OshkoshCorporation Strong weekly Stock price targets for OshkoshCorporation OSK are 126.5 and 134.66 | Weekly Target 1 | 120.08 | | Weekly Target 2 | 124.75 | | Weekly Target 3 | 128.23666666667 | | Weekly Target 4 | 132.91 | | Weekly Target 5 | 136.4 |
Weekly price and volumes for Oshkosh Corporation
| Date |
Closing |
Open |
Range |
Volume |
Fri 05 December 2025 |
129.43 (0.98%) |
126.23 |
123.56 - 131.72 |
1.1311 times |
Fri 28 November 2025 |
128.18 (4.28%) |
123.98 |
122.72 - 128.97 |
0.6401 times |
Fri 21 November 2025 |
122.92 (-1.33%) |
123.80 |
118.49 - 125.01 |
0.8724 times |
Fri 14 November 2025 |
124.58 (2.57%) |
122.92 |
120.01 - 127.36 |
0.9475 times |
Fri 07 November 2025 |
121.46 (-1.48%) |
120.45 |
119.38 - 127.46 |
1.2469 times |
Fri 31 October 2025 |
123.29 (0%) |
123.00 |
121.26 - 125.59 |
0.3441 times |
Fri 31 October 2025 |
123.29 (-11.6%) |
141.12 |
121.26 - 141.12 |
2.1573 times |
Fri 24 October 2025 |
139.47 (5.76%) |
133.29 |
133.08 - 141.13 |
0.9874 times |
Fri 17 October 2025 |
131.88 (1.09%) |
126.46 |
126.46 - 137.37 |
1.3997 times |
Tue 07 October 2025 |
130.46 (-0.79%) |
131.35 |
129.79 - 133.55 |
0.2736 times |
Fri 03 October 2025 |
131.50 (1.18%) |
130.60 |
127.30 - 133.53 |
0.8305 times |
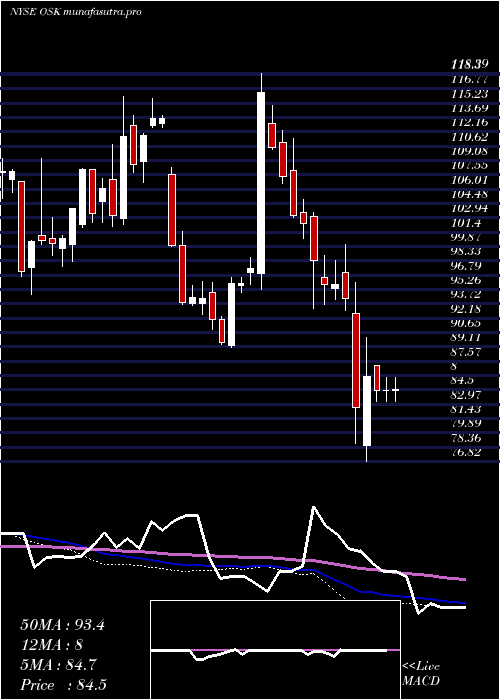
Monthly price and charts OshkoshCorporation Strong monthly Stock price targets for OshkoshCorporation OSK are 126.5 and 134.66 | Monthly Target 1 | 120.08 | | Monthly Target 2 | 124.75 | | Monthly Target 3 | 128.23666666667 | | Monthly Target 4 | 132.91 | | Monthly Target 5 | 136.4 |
Monthly price and volumes Oshkosh Corporation
| Date |
Closing |
Open |
Range |
Volume |
Fri 05 December 2025 |
129.43 (0.98%) |
126.23 |
123.56 - 131.72 |
0.2499 times |
Fri 28 November 2025 |
128.18 (3.97%) |
120.45 |
118.49 - 128.97 |
0.8189 times |
Fri 31 October 2025 |
123.29 (-4.94%) |
128.27 |
121.26 - 141.13 |
1.2317 times |
Tue 30 September 2025 |
129.70 (-6.94%) |
138.00 |
125.75 - 140.62 |
0.9759 times |
Fri 29 August 2025 |
139.37 (10.15%) |
130.21 |
126.51 - 144.30 |
0.9227 times |
Thu 31 July 2025 |
126.53 (11.44%) |
114.17 |
113.93 - 130.43 |
1.2496 times |
Mon 30 June 2025 |
113.54 (14.47%) |
99.47 |
97.28 - 114.37 |
1.1817 times |
Fri 30 May 2025 |
99.19 (18.42%) |
84.76 |
84.29 - 103.30 |
1.0653 times |
Wed 30 April 2025 |
83.76 (-10.97%) |
92.68 |
76.82 - 96.02 |
1.2297 times |
Mon 31 March 2025 |
94.08 (-8.04%) |
103.07 |
91.40 - 103.56 |
1.0746 times |
Fri 28 February 2025 |
102.30 (-12.11%) |
113.10 |
100.71 - 115.00 |
0.9809 times |

DMA SMA EMA moving averages of Oshkosh Corporation OSK
DMA (daily moving average) of Oshkosh Corporation OSK
| DMA period | DMA value | | 5 day DMA | 128.1 | | 12 day DMA | 125.99 | | 20 day DMA | 124.91 | | 35 day DMA | 127.34 | | 50 day DMA | 128.36 | | 100 day DMA | 131.43 | | 150 day DMA | 122.73 | | 200 day DMA | 115.61 | EMA (exponential moving average) of Oshkosh Corporation OSK
| EMA period | EMA current | EMA prev | EMA prev2 | | 5 day EMA | 128.56 | 128.12 | 126.72 | | 12 day EMA | 127 | 126.56 | 125.77 | | 20 day EMA | 126.6 | 126.3 | 125.81 | | 35 day EMA | 127.41 | 127.29 | 127.08 | | 50 day EMA | 128.85 | 128.83 | 128.74 |
SMA (simple moving average) of Oshkosh Corporation OSK
| SMA period | SMA current | SMA prev | SMA prev2 | | 5 day SMA | 128.1 | 127.85 | 127.09 | | 12 day SMA | 125.99 | 125.39 | 124.61 | | 20 day SMA | 124.91 | 124.72 | 124.42 | | 35 day SMA | 127.34 | 127.53 | 127.68 | | 50 day SMA | 128.36 | 128.43 | 128.47 | | 100 day SMA | 131.43 | 131.39 | 131.35 | | 150 day SMA | 122.73 | 122.46 | 122.18 | | 200 day SMA | 115.61 | 115.51 | 115.41 |
|
|
