OppenheimerHoldings OPY full analysis,charts,indicators,moving averages,SMA,DMA,EMA,ADX,MACD,RSIOppenheimer Holdings OPY WideScreen charts, DMA,SMA,EMA technical analysis, forecast prediction, by indicators ADX,MACD,RSI,CCI NYSE stock exchange
operates under Finance sector & deals in Investment Bankers Brokers Service
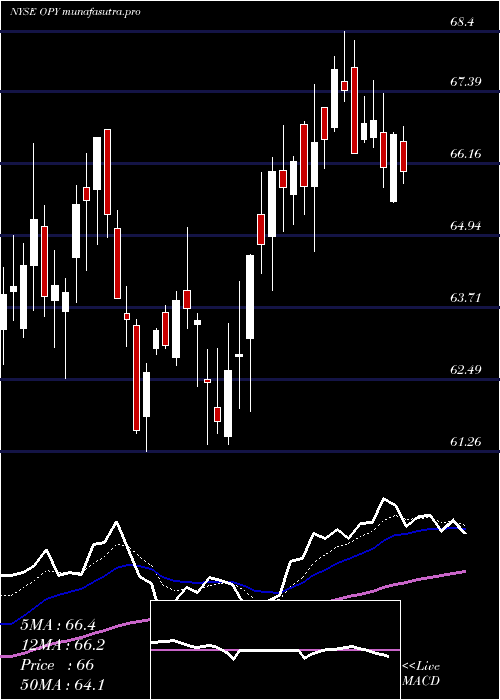
Daily price and charts and targets OppenheimerHoldings Strong Daily Stock price targets for OppenheimerHoldings OPY are 68.09 and 69.55 | Daily Target 1 | 66.99 | | Daily Target 2 | 67.72 | | Daily Target 3 | 68.45 | | Daily Target 4 | 69.18 | | Daily Target 5 | 69.91 |
Daily price and volume Oppenheimer Holdings
| Date |
Closing |
Open |
Range |
Volume |
Tue 21 October 2025 |
68.45 (0.31%) |
67.72 |
67.72 - 69.18 |
0.8951 times |
Mon 20 October 2025 |
68.24 (1.61%) |
67.62 |
67.61 - 68.75 |
0.8603 times |
Fri 17 October 2025 |
67.16 (1.18%) |
66.53 |
66.05 - 67.58 |
1.0554 times |
Thu 16 October 2025 |
66.38 (-4.38%) |
69.84 |
66.36 - 70.31 |
0.855 times |
Wed 15 October 2025 |
69.42 (0.01%) |
70.55 |
68.62 - 72.16 |
1.3413 times |
Tue 14 October 2025 |
69.41 (1.34%) |
68.26 |
67.51 - 69.83 |
0.8096 times |
Mon 13 October 2025 |
68.49 (-3.32%) |
67.32 |
66.78 - 68.49 |
1.5283 times |
Tue 07 October 2025 |
70.84 (-1.42%) |
71.86 |
70.43 - 72.02 |
0.847 times |
Mon 06 October 2025 |
71.86 (0.24%) |
72.39 |
70.98 - 72.70 |
0.4189 times |
Fri 03 October 2025 |
71.69 (1.26%) |
70.79 |
69.91 - 71.74 |
1.3893 times |
Thu 02 October 2025 |
70.80 (-2.4%) |
72.20 |
70.63 - 73.10 |
0.7697 times |
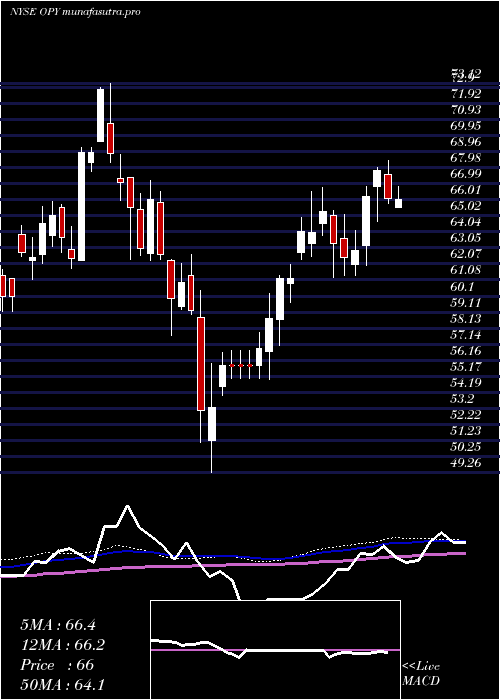
Weekly price and charts OppenheimerHoldings Strong weekly Stock price targets for OppenheimerHoldings OPY are 68.03 and 69.6 | Weekly Target 1 | 66.84 | | Weekly Target 2 | 67.65 | | Weekly Target 3 | 68.413333333333 | | Weekly Target 4 | 69.22 | | Weekly Target 5 | 69.98 |
Weekly price and volumes for Oppenheimer Holdings
| Date |
Closing |
Open |
Range |
Volume |
Tue 21 October 2025 |
68.45 (1.92%) |
67.62 |
67.61 - 69.18 |
0.3355 times |
Fri 17 October 2025 |
67.16 (-5.19%) |
67.32 |
66.05 - 72.16 |
1.0684 times |
Tue 07 October 2025 |
70.84 (-1.19%) |
72.39 |
70.43 - 72.70 |
0.242 times |
Fri 03 October 2025 |
71.69 (-6.39%) |
76.41 |
69.91 - 77.04 |
1.141 times |
Fri 26 September 2025 |
76.58 (-2.03%) |
77.57 |
75.75 - 79.77 |
1.002 times |
Fri 19 September 2025 |
78.17 (1.98%) |
76.87 |
76.64 - 79.99 |
1.7195 times |
Fri 12 September 2025 |
76.65 (5.38%) |
72.76 |
70.50 - 77.50 |
2.5024 times |
Fri 05 September 2025 |
72.74 (0.23%) |
72.01 |
69.59 - 75.00 |
0.9754 times |
Fri 29 August 2025 |
72.57 (0%) |
71.26 |
71.08 - 72.77 |
0.2865 times |
Fri 29 August 2025 |
72.57 (0.67%) |
71.83 |
70.79 - 72.77 |
0.7272 times |
Fri 22 August 2025 |
72.09 (2.23%) |
70.68 |
69.18 - 72.72 |
0.7477 times |
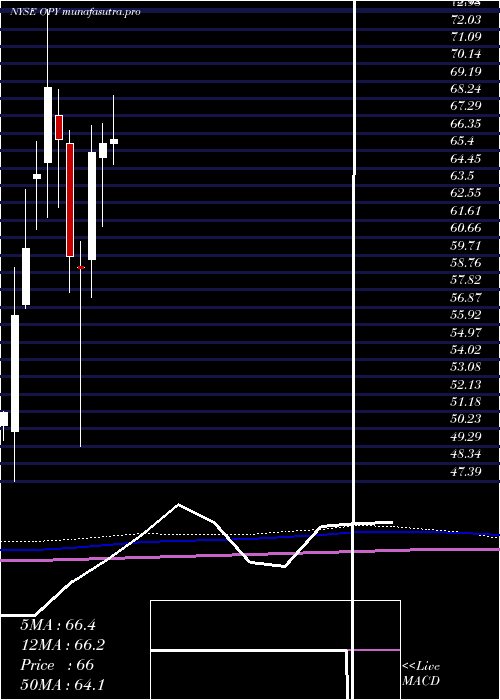
Monthly price and charts OppenheimerHoldings Strong monthly Stock price targets for OppenheimerHoldings OPY are 63.25 and 71.26 | Monthly Target 1 | 61.51 | | Monthly Target 2 | 64.98 | | Monthly Target 3 | 69.52 | | Monthly Target 4 | 72.99 | | Monthly Target 5 | 77.53 |
Monthly price and volumes Oppenheimer Holdings
| Date |
Closing |
Open |
Range |
Volume |
Tue 21 October 2025 |
68.45 (-7.39%) |
73.09 |
66.05 - 74.06 |
0.5166 times |
Tue 30 September 2025 |
73.91 (1.85%) |
72.01 |
69.59 - 79.99 |
1.5284 times |
Fri 29 August 2025 |
72.57 (-4.27%) |
75.26 |
69.18 - 75.50 |
0.9495 times |
Thu 31 July 2025 |
75.81 (15.27%) |
65.78 |
64.66 - 77.83 |
1.3152 times |
Mon 30 June 2025 |
65.77 (0.74%) |
65.05 |
61.26 - 66.87 |
1.7332 times |
Fri 30 May 2025 |
65.29 (10.64%) |
59.50 |
57.41 - 66.75 |
1.2063 times |
Wed 30 April 2025 |
59.01 (-1.04%) |
59.04 |
49.26 - 60.46 |
1.0529 times |
Mon 31 March 2025 |
59.63 (-9.65%) |
65.82 |
57.68 - 66.53 |
0.5943 times |
Fri 28 February 2025 |
66.00 (-4.1%) |
67.33 |
62.30 - 68.76 |
0.4916 times |
Fri 31 January 2025 |
68.82 (7.38%) |
64.78 |
61.76 - 73.12 |
0.6121 times |
Tue 31 December 2024 |
64.09 (6.73%) |
63.89 |
61.10 - 65.90 |
0.4835 times |
DMA SMA EMA moving averages of Oppenheimer Holdings OPY
DMA (daily moving average) of Oppenheimer Holdings OPY
| DMA period | DMA value | | 5 day DMA | 67.93 | | 12 day DMA | 69.61 | | 20 day DMA | 72.38 | | 35 day DMA | 73.42 | | 50 day DMA | 72.79 | | 100 day DMA | 70.11 | | 150 day DMA | 66.43 | | 200 day DMA | 66.24 | EMA (exponential moving average) of Oppenheimer Holdings OPY
| EMA period | EMA current | EMA prev | EMA prev2 | | 5 day EMA | 68.32 | 68.25 | 68.26 | | 12 day EMA | 69.8 | 70.04 | 70.37 | | 20 day EMA | 71.06 | 71.34 | 71.67 | | 35 day EMA | 71.84 | 72.04 | 72.26 | | 50 day EMA | 72.37 | 72.53 | 72.7 |
SMA (simple moving average) of Oppenheimer Holdings OPY
| SMA period | SMA current | SMA prev | SMA prev2 | | 5 day SMA | 67.93 | 68.12 | 68.17 | | 12 day SMA | 69.61 | 70.06 | 70.7 | | 20 day SMA | 72.38 | 72.95 | 73.44 | | 35 day SMA | 73.42 | 73.51 | 73.6 | | 50 day SMA | 72.79 | 72.85 | 72.96 | | 100 day SMA | 70.11 | 70.07 | 70.03 | | 150 day SMA | 66.43 | 66.36 | 66.3 | | 200 day SMA | 66.24 | 66.22 | 66.2 |
|
|
