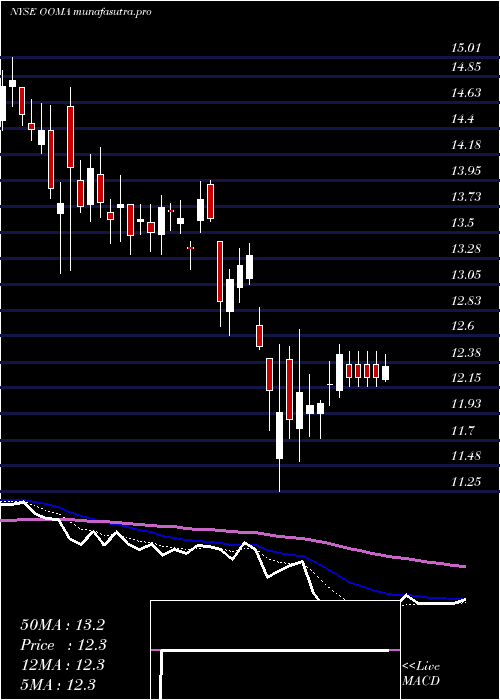
OomaInc OOMA full analysis,charts,indicators,moving averages,SMA,DMA,EMA,ADX,MACD,RSIOoma Inc OOMA WideScreen charts, DMA,SMA,EMA technical analysis, forecast prediction, by indicators ADX,MACD,RSI,CCI NYSE stock exchange
operates under Technology sector & deals in EDP Services
Daily price and charts and targets OomaInc Strong Daily Stock price targets for OomaInc OOMA are 11.11 and 11.34 | Daily Target 1 | 11.04 | | Daily Target 2 | 11.17 | | Daily Target 3 | 11.273333333333 | | Daily Target 4 | 11.4 | | Daily Target 5 | 11.5 |
Daily price and volume Ooma Inc
| Date |
Closing |
Open |
Range |
Volume |
Thu 04 December 2025 |
11.29 (-0.62%) |
11.32 |
11.15 - 11.38 |
0.754 times |
Wed 03 December 2025 |
11.36 (3.18%) |
11.06 |
11.05 - 11.39 |
0.7696 times |
Tue 02 December 2025 |
11.01 (0.27%) |
11.05 |
10.98 - 11.12 |
0.8085 times |
Mon 01 December 2025 |
10.98 (-2.31%) |
11.06 |
10.98 - 11.27 |
1.0038 times |
Fri 28 November 2025 |
11.24 (-0.27%) |
11.35 |
11.13 - 11.35 |
0.4428 times |
Wed 26 November 2025 |
11.27 (-4.33%) |
11.68 |
11.18 - 11.68 |
0.9369 times |
Tue 25 November 2025 |
11.78 (7.38%) |
11.11 |
11.10 - 11.98 |
1.8248 times |
Mon 24 November 2025 |
10.97 (0.83%) |
11.03 |
10.90 - 11.41 |
1.5579 times |
Fri 21 November 2025 |
10.88 (2.26%) |
10.58 |
9.79 - 10.91 |
1.1556 times |
Thu 20 November 2025 |
10.64 (-0.47%) |
10.86 |
10.61 - 10.95 |
0.7462 times |
Wed 19 November 2025 |
10.69 (-2.91%) |
11.01 |
10.62 - 11.01 |
1.3649 times |
Weekly price and charts OomaInc Strong weekly Stock price targets for OomaInc OOMA are 11.14 and 11.55 | Weekly Target 1 | 10.81 | | Weekly Target 2 | 11.05 | | Weekly Target 3 | 11.22 | | Weekly Target 4 | 11.46 | | Weekly Target 5 | 11.63 |
Weekly price and volumes for Ooma Inc
| Date |
Closing |
Open |
Range |
Volume |
Thu 04 December 2025 |
11.29 (0.44%) |
11.06 |
10.98 - 11.39 |
0.9266 times |
Fri 28 November 2025 |
11.24 (3.31%) |
11.03 |
10.90 - 11.98 |
1.3227 times |
Fri 21 November 2025 |
10.88 (-4.23%) |
11.28 |
9.79 - 11.33 |
1.4083 times |
Fri 14 November 2025 |
11.36 (-2.07%) |
11.66 |
11.26 - 11.89 |
1.1278 times |
Fri 07 November 2025 |
11.60 (3.29%) |
11.89 |
11.48 - 12.16 |
1.1144 times |
Fri 31 October 2025 |
11.23 (0%) |
11.00 |
10.99 - 11.28 |
0.1792 times |
Fri 31 October 2025 |
11.23 (-1.06%) |
11.41 |
10.99 - 11.73 |
1.4494 times |
Fri 24 October 2025 |
11.35 (4.03%) |
10.97 |
10.95 - 11.40 |
1.0158 times |
Fri 17 October 2025 |
10.91 (-3.02%) |
11.10 |
10.89 - 11.42 |
1.0539 times |
Tue 07 October 2025 |
11.25 (-2.93%) |
11.72 |
11.24 - 11.75 |
0.402 times |
Fri 03 October 2025 |
11.59 (-7.13%) |
12.55 |
11.53 - 12.55 |
1.2299 times |

Monthly price and charts OomaInc Strong monthly Stock price targets for OomaInc OOMA are 11.14 and 11.55 | Monthly Target 1 | 10.81 | | Monthly Target 2 | 11.05 | | Monthly Target 3 | 11.22 | | Monthly Target 4 | 11.46 | | Monthly Target 5 | 11.63 |
Monthly price and volumes Ooma Inc
| Date |
Closing |
Open |
Range |
Volume |
Thu 04 December 2025 |
11.29 (0.44%) |
11.06 |
10.98 - 11.39 |
0.1558 times |
Fri 28 November 2025 |
11.24 (0.09%) |
11.89 |
9.79 - 12.16 |
0.8362 times |
Fri 31 October 2025 |
11.23 (-6.34%) |
11.89 |
10.89 - 12.15 |
0.8104 times |
Tue 30 September 2025 |
11.99 (-7.2%) |
12.79 |
11.88 - 13.28 |
1.3668 times |
Fri 29 August 2025 |
12.92 (13.53%) |
11.29 |
10.94 - 13.50 |
1.1862 times |
Thu 31 July 2025 |
11.38 (-11.78%) |
12.85 |
11.33 - 13.37 |
1.2688 times |
Mon 30 June 2025 |
12.90 (-5.49%) |
13.57 |
12.18 - 13.69 |
1.3403 times |
Fri 30 May 2025 |
13.65 (11.61%) |
12.28 |
12.09 - 13.94 |
0.8974 times |
Wed 30 April 2025 |
12.23 (-6.57%) |
13.02 |
11.25 - 13.40 |
0.9928 times |
Mon 31 March 2025 |
13.09 (-8.97%) |
14.38 |
12.60 - 14.75 |
1.1453 times |
Fri 28 February 2025 |
14.38 (0.07%) |
14.12 |
13.78 - 15.65 |
0.7548 times |

DMA SMA EMA moving averages of Ooma Inc OOMA
DMA (daily moving average) of Ooma Inc OOMA
| DMA period | DMA value | | 5 day DMA | 11.18 | | 12 day DMA | 11.09 | | 20 day DMA | 11.29 | | 35 day DMA | 11.31 | | 50 day DMA | 11.51 | | 100 day DMA | 11.82 | | 150 day DMA | 12.2 | | 200 day DMA | 12.48 | EMA (exponential moving average) of Ooma Inc OOMA
| EMA period | EMA current | EMA prev | EMA prev2 | | 5 day EMA | 11.22 | 11.19 | 11.1 | | 12 day EMA | 11.21 | 11.2 | 11.17 | | 20 day EMA | 11.26 | 11.26 | 11.25 | | 35 day EMA | 11.43 | 11.44 | 11.44 | | 50 day EMA | 11.59 | 11.6 | 11.61 |
SMA (simple moving average) of Ooma Inc OOMA
| SMA period | SMA current | SMA prev | SMA prev2 | | 5 day SMA | 11.18 | 11.17 | 11.26 | | 12 day SMA | 11.09 | 11.08 | 11.08 | | 20 day SMA | 11.29 | 11.33 | 11.37 | | 35 day SMA | 11.31 | 11.31 | 11.31 | | 50 day SMA | 11.51 | 11.54 | 11.57 | | 100 day SMA | 11.82 | 11.83 | 11.84 | | 150 day SMA | 12.2 | 12.2 | 12.2 | | 200 day SMA | 12.48 | 12.5 | 12.52 |
|
|
