OmnicomGroup OMC full analysis,charts,indicators,moving averages,SMA,DMA,EMA,ADX,MACD,RSIOmnicom Group OMC WideScreen charts, DMA,SMA,EMA technical analysis, forecast prediction, by indicators ADX,MACD,RSI,CCI NYSE stock exchange
operates under Technology sector & deals in Advertising
Daily price and charts and targets OmnicomGroup Strong Daily Stock price targets for OmnicomGroup OMC are 71.87 and 76.23 | Daily Target 1 | 68.43 | | Daily Target 2 | 70.94 | | Daily Target 3 | 72.793333333333 | | Daily Target 4 | 75.3 | | Daily Target 5 | 77.15 |
Daily price and volume Omnicom Group
| Date |
Closing |
Open |
Range |
Volume |
Fri 05 December 2025 |
73.44 (4.66%) |
70.31 |
70.29 - 74.65 |
1.1226 times |
Thu 04 December 2025 |
70.17 (-1.17%) |
70.97 |
69.86 - 71.45 |
0.7726 times |
Wed 03 December 2025 |
71.00 (-2.03%) |
72.34 |
70.29 - 73.04 |
0.9087 times |
Tue 02 December 2025 |
72.47 (0.64%) |
72.05 |
71.05 - 72.75 |
0.839 times |
Mon 01 December 2025 |
72.01 (0.54%) |
71.71 |
71.62 - 73.39 |
1.0768 times |
Fri 28 November 2025 |
71.62 (0.17%) |
71.06 |
70.89 - 72.69 |
1.2838 times |
Wed 26 November 2025 |
71.50 (-1.85%) |
72.60 |
71.21 - 73.68 |
1.5613 times |
Tue 25 November 2025 |
72.85 (-2.65%) |
75.51 |
72.60 - 75.57 |
1.0536 times |
Mon 24 November 2025 |
74.83 (-0.05%) |
74.63 |
73.70 - 75.50 |
0.9033 times |
Fri 21 November 2025 |
74.87 (4.7%) |
72.19 |
71.89 - 75.02 |
0.4784 times |
Thu 20 November 2025 |
71.51 (-0.68%) |
72.00 |
71.15 - 72.11 |
0.3962 times |
Weekly price and charts OmnicomGroup Strong weekly Stock price targets for OmnicomGroup OMC are 71.65 and 76.44 | Weekly Target 1 | 67.86 | | Weekly Target 2 | 70.65 | | Weekly Target 3 | 72.65 | | Weekly Target 4 | 75.44 | | Weekly Target 5 | 77.44 |
Weekly price and volumes for Omnicom Group
| Date |
Closing |
Open |
Range |
Volume |
Fri 05 December 2025 |
73.44 (2.54%) |
71.71 |
69.86 - 74.65 |
1.9312 times |
Fri 28 November 2025 |
71.62 (-4.34%) |
74.63 |
70.89 - 75.57 |
1.9649 times |
Fri 21 November 2025 |
74.87 (3.65%) |
72.02 |
71.15 - 75.02 |
0.8556 times |
Fri 14 November 2025 |
72.23 (-2.76%) |
74.08 |
71.11 - 74.57 |
0.7771 times |
Fri 07 November 2025 |
74.28 (-0.99%) |
73.19 |
72.77 - 75.55 |
0.6224 times |
Fri 31 October 2025 |
75.02 (0%) |
74.49 |
74.08 - 75.29 |
0.1781 times |
Fri 31 October 2025 |
75.02 (-5.04%) |
79.10 |
73.82 - 79.84 |
1.0328 times |
Fri 24 October 2025 |
79.00 (1.91%) |
77.86 |
77.48 - 82.50 |
1.2065 times |
Fri 17 October 2025 |
77.52 (-2.81%) |
76.98 |
75.70 - 79.93 |
0.9602 times |
Tue 07 October 2025 |
79.76 (2.77%) |
78.49 |
77.86 - 80.38 |
0.4711 times |
Fri 03 October 2025 |
77.61 (0.73%) |
77.33 |
75.81 - 82.96 |
1.4588 times |

Monthly price and charts OmnicomGroup Strong monthly Stock price targets for OmnicomGroup OMC are 71.65 and 76.44 | Monthly Target 1 | 67.86 | | Monthly Target 2 | 70.65 | | Monthly Target 3 | 72.65 | | Monthly Target 4 | 75.44 | | Monthly Target 5 | 77.44 |
Monthly price and volumes Omnicom Group
| Date |
Closing |
Open |
Range |
Volume |
Fri 05 December 2025 |
73.44 (2.54%) |
71.71 |
69.86 - 74.65 |
0.4599 times |
Fri 28 November 2025 |
71.62 (-4.53%) |
73.19 |
70.89 - 75.57 |
1.0049 times |
Fri 31 October 2025 |
75.02 (-7.98%) |
80.97 |
73.82 - 82.50 |
1.08 times |
Tue 30 September 2025 |
81.53 (4.09%) |
77.07 |
74.07 - 82.96 |
0.9956 times |
Fri 29 August 2025 |
78.33 (8.72%) |
71.94 |
70.65 - 80.04 |
0.9472 times |
Thu 31 July 2025 |
72.05 (0.15%) |
71.47 |
70.38 - 79.30 |
1.3782 times |
Mon 30 June 2025 |
71.94 (-2.04%) |
71.47 |
68.37 - 74.09 |
1.2822 times |
Fri 30 May 2025 |
73.44 (-3.57%) |
76.20 |
71.98 - 79.08 |
0.6967 times |
Wed 30 April 2025 |
76.16 (-8.14%) |
82.98 |
69.13 - 82.98 |
0.8972 times |
Mon 31 March 2025 |
82.91 (0.18%) |
83.00 |
78.69 - 89.27 |
1.2581 times |
Fri 28 February 2025 |
82.76 (-4.64%) |
85.91 |
80.31 - 88.52 |
0.8101 times |

DMA SMA EMA moving averages of Omnicom Group OMC
DMA (daily moving average) of Omnicom Group OMC
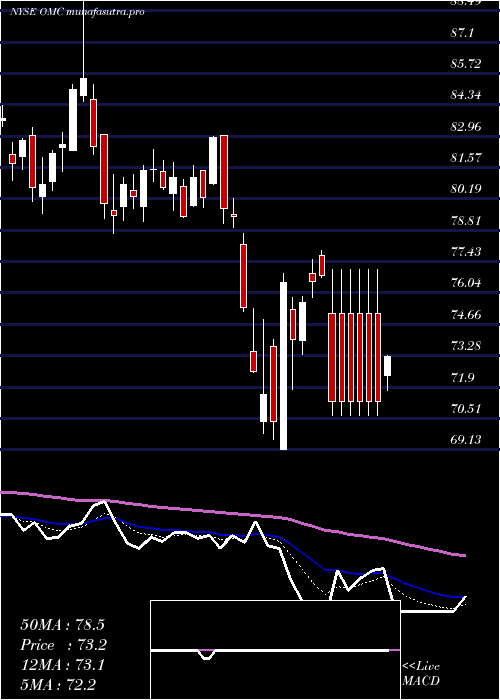
| DMA period | DMA value | | 5 day DMA | 71.82 | | 12 day DMA | 72.36 | | 20 day DMA | 72.76 | | 35 day DMA | 74.47 | | 50 day DMA | 75.5 | | 100 day DMA | 75.57 | | 150 day DMA | 74.93 | | 200 day DMA | 75.77 | EMA (exponential moving average) of Omnicom Group OMC
| EMA period | EMA current | EMA prev | EMA prev2 | | 5 day EMA | 72.03 | 71.32 | 71.89 | | 12 day EMA | 72.35 | 72.15 | 72.51 | | 20 day EMA | 72.92 | 72.86 | 73.14 | | 35 day EMA | 74.02 | 74.05 | 74.28 | | 50 day EMA | 75.16 | 75.23 | 75.44 |
SMA (simple moving average) of Omnicom Group OMC
| SMA period | SMA current | SMA prev | SMA prev2 | | 5 day SMA | 71.82 | 71.45 | 71.72 | | 12 day SMA | 72.36 | 72.36 | 72.6 | | 20 day SMA | 72.76 | 72.74 | 72.9 | | 35 day SMA | 74.47 | 74.58 | 74.84 | | 50 day SMA | 75.5 | 75.53 | 75.62 | | 100 day SMA | 75.57 | 75.56 | 75.6 | | 150 day SMA | 74.93 | 74.94 | 74.97 | | 200 day SMA | 75.77 | 75.82 | 75.88 |
|
|
