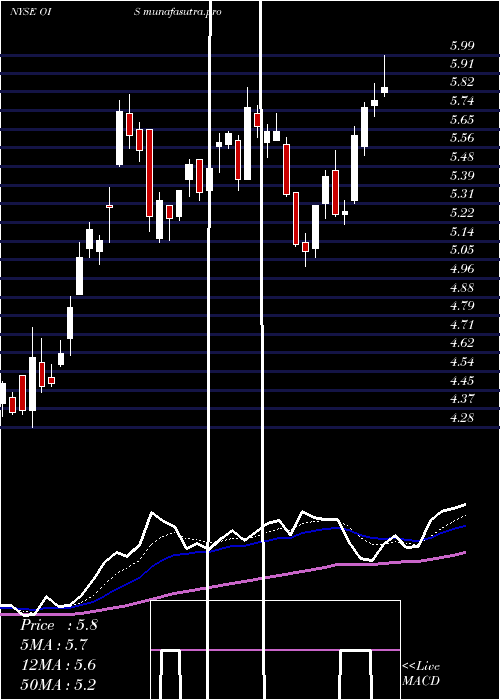
OilStates OIS full analysis,charts,indicators,moving averages,SMA,DMA,EMA,ADX,MACD,RSIOil States OIS WideScreen charts, DMA,SMA,EMA technical analysis, forecast prediction, by indicators ADX,MACD,RSI,CCI NYSE stock exchange
operates under Energy sector & deals in Metal Fabrications
Daily price and charts and targets OilStates Strong Daily Stock price targets for OilStates OIS are 6.75 and 7.03 | Daily Target 1 | 6.52 | | Daily Target 2 | 6.69 | | Daily Target 3 | 6.7966666666667 | | Daily Target 4 | 6.97 | | Daily Target 5 | 7.08 |
Daily price and volume Oil States
| Date |
Closing |
Open |
Range |
Volume |
Thu 04 December 2025 |
6.87 (2.38%) |
6.71 |
6.62 - 6.90 |
1.0881 times |
Wed 03 December 2025 |
6.71 (5.84%) |
6.42 |
6.35 - 6.75 |
1.4199 times |
Tue 02 December 2025 |
6.34 (-0.31%) |
6.42 |
6.19 - 6.47 |
1.026 times |
Mon 01 December 2025 |
6.36 (0.95%) |
6.29 |
6.29 - 6.55 |
1.542 times |
Fri 28 November 2025 |
6.30 (1.94%) |
6.18 |
6.18 - 6.35 |
0.3306 times |
Wed 26 November 2025 |
6.18 (0.32%) |
6.15 |
6.13 - 6.33 |
0.6904 times |
Tue 25 November 2025 |
6.16 (0%) |
6.16 |
6.05 - 6.21 |
0.8673 times |
Mon 24 November 2025 |
6.16 (0.65%) |
6.07 |
5.96 - 6.22 |
0.8952 times |
Fri 21 November 2025 |
6.12 (4.44%) |
5.84 |
5.83 - 6.14 |
0.9939 times |
Thu 20 November 2025 |
5.86 (-4.25%) |
6.20 |
5.86 - 6.34 |
1.1466 times |
Wed 19 November 2025 |
6.12 (-1.61%) |
6.09 |
6.00 - 6.20 |
0.7515 times |
Weekly price and charts OilStates Strong weekly Stock price targets for OilStates OIS are 6.53 and 7.24 | Weekly Target 1 | 5.94 | | Weekly Target 2 | 6.41 | | Weekly Target 3 | 6.6533333333333 | | Weekly Target 4 | 7.12 | | Weekly Target 5 | 7.36 |
Weekly price and volumes for Oil States
| Date |
Closing |
Open |
Range |
Volume |
Thu 04 December 2025 |
6.87 (9.05%) |
6.29 |
6.19 - 6.90 |
1.3144 times |
Fri 28 November 2025 |
6.30 (2.94%) |
6.07 |
5.96 - 6.35 |
0.7207 times |
Fri 21 November 2025 |
6.12 (-2.86%) |
6.21 |
5.83 - 6.39 |
1.203 times |
Fri 14 November 2025 |
6.30 (2.44%) |
6.24 |
6.03 - 6.61 |
1.168 times |
Fri 07 November 2025 |
6.15 (3.02%) |
6.22 |
6.02 - 6.27 |
0.9249 times |
Fri 31 October 2025 |
5.97 (0%) |
6.35 |
5.50 - 6.35 |
0.6152 times |
Fri 31 October 2025 |
5.97 (-10.23%) |
6.79 |
5.50 - 6.88 |
1.5933 times |
Fri 24 October 2025 |
6.65 (14.26%) |
5.83 |
5.83 - 6.79 |
1.2566 times |
Fri 17 October 2025 |
5.82 (-6.43%) |
5.71 |
5.62 - 6.17 |
0.8823 times |
Tue 07 October 2025 |
6.22 (-1.11%) |
6.34 |
6.14 - 6.47 |
0.3216 times |
Fri 03 October 2025 |
6.29 (1.45%) |
6.25 |
5.94 - 6.42 |
1.1066 times |

Monthly price and charts OilStates Strong monthly Stock price targets for OilStates OIS are 6.53 and 7.24 | Monthly Target 1 | 5.94 | | Monthly Target 2 | 6.41 | | Monthly Target 3 | 6.6533333333333 | | Monthly Target 4 | 7.12 | | Monthly Target 5 | 7.36 |
Monthly price and volumes Oil States
| Date |
Closing |
Open |
Range |
Volume |
Thu 04 December 2025 |
6.87 (9.05%) |
6.29 |
6.19 - 6.90 |
0.2578 times |
Fri 28 November 2025 |
6.30 (5.53%) |
6.22 |
5.83 - 6.61 |
0.7878 times |
Fri 31 October 2025 |
5.97 (-1.49%) |
6.02 |
5.50 - 6.88 |
1.0181 times |
Tue 30 September 2025 |
6.06 (8.21%) |
5.49 |
5.37 - 6.42 |
0.7684 times |
Fri 29 August 2025 |
5.60 (12.22%) |
4.95 |
4.75 - 5.65 |
0.9725 times |
Thu 31 July 2025 |
4.99 (-6.9%) |
5.37 |
4.80 - 5.99 |
1.2255 times |
Mon 30 June 2025 |
5.36 (23.22%) |
4.52 |
4.28 - 5.81 |
1.208 times |
Fri 30 May 2025 |
4.35 (23.93%) |
3.65 |
3.61 - 4.90 |
1.0754 times |
Wed 30 April 2025 |
3.51 (-31.84%) |
5.15 |
3.08 - 5.25 |
1.45 times |
Mon 31 March 2025 |
5.15 (-5.33%) |
5.49 |
4.66 - 5.59 |
1.2363 times |
Fri 28 February 2025 |
5.44 (7.09%) |
5.05 |
4.64 - 5.57 |
1.061 times |

DMA SMA EMA moving averages of Oil States OIS
DMA (daily moving average) of Oil States OIS
| DMA period | DMA value | | 5 day DMA | 6.52 | | 12 day DMA | 6.28 | | 20 day DMA | 6.27 | | 35 day DMA | 6.28 | | 50 day DMA | 6.23 | | 100 day DMA | 5.81 | | 150 day DMA | 5.48 | | 200 day DMA | 5.24 | EMA (exponential moving average) of Oil States OIS
| EMA period | EMA current | EMA prev | EMA prev2 | | 5 day EMA | 6.57 | 6.42 | 6.28 | | 12 day EMA | 6.39 | 6.3 | 6.23 | | 20 day EMA | 6.34 | 6.28 | 6.23 | | 35 day EMA | 6.27 | 6.23 | 6.2 | | 50 day EMA | 6.23 | 6.2 | 6.18 |
SMA (simple moving average) of Oil States OIS
| SMA period | SMA current | SMA prev | SMA prev2 | | 5 day SMA | 6.52 | 6.38 | 6.27 | | 12 day SMA | 6.28 | 6.22 | 6.19 | | 20 day SMA | 6.27 | 6.24 | 6.21 | | 35 day SMA | 6.28 | 6.26 | 6.24 | | 50 day SMA | 6.23 | 6.21 | 6.19 | | 100 day SMA | 5.81 | 5.8 | 5.79 | | 150 day SMA | 5.48 | 5.46 | 5.44 | | 200 day SMA | 5.24 | 5.24 | 5.23 |
|
|
