OfgBancorp OFG full analysis,charts,indicators,moving averages,SMA,DMA,EMA,ADX,MACD,RSIOfg Bancorp OFG WideScreen charts, DMA,SMA,EMA technical analysis, forecast prediction, by indicators ADX,MACD,RSI,CCI NYSE stock exchange
operates under Finance sector & deals in Major Banks
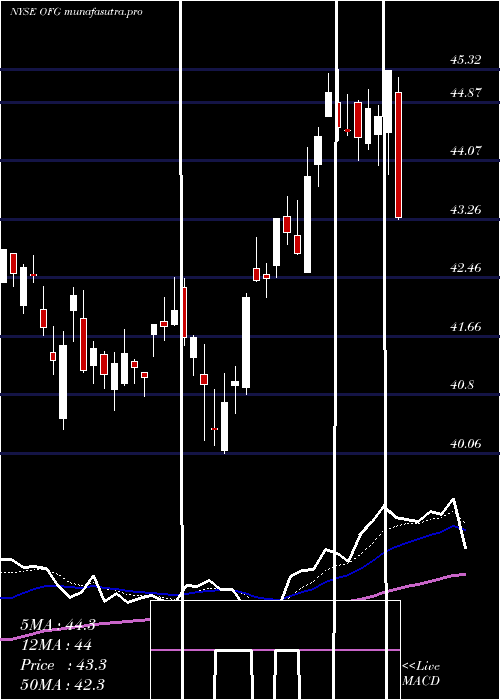
Daily price and charts and targets OfgBancorp Strong Daily Stock price targets for OfgBancorp OFG are 40.55 and 41.07 | Daily Target 1 | 40.19 | | Daily Target 2 | 40.39 | | Daily Target 3 | 40.713333333333 | | Daily Target 4 | 40.91 | | Daily Target 5 | 41.23 |
Daily price and volume Ofg Bancorp
| Date |
Closing |
Open |
Range |
Volume |
Thu 04 December 2025 |
40.58 (-0.27%) |
40.52 |
40.52 - 41.04 |
0.6781 times |
Wed 03 December 2025 |
40.69 (1.62%) |
39.97 |
39.97 - 40.88 |
0.6333 times |
Tue 02 December 2025 |
40.04 (-0.32%) |
40.37 |
39.85 - 40.37 |
0.6557 times |
Mon 01 December 2025 |
40.17 (1.11%) |
39.75 |
39.74 - 40.28 |
0.658 times |
Fri 28 November 2025 |
39.73 (-0.63%) |
40.17 |
39.63 - 40.17 |
0.3324 times |
Wed 26 November 2025 |
39.98 (-0.42%) |
40.01 |
39.97 - 40.49 |
1.3035 times |
Tue 25 November 2025 |
40.15 (2.21%) |
39.53 |
39.53 - 40.52 |
1.0933 times |
Mon 24 November 2025 |
39.28 (-1.28%) |
39.63 |
39.19 - 39.79 |
0.9067 times |
Fri 21 November 2025 |
39.79 (1.22%) |
39.66 |
39.29 - 40.26 |
2.9151 times |
Thu 20 November 2025 |
39.31 (-1.03%) |
39.99 |
39.26 - 40.38 |
0.8238 times |
Wed 19 November 2025 |
39.72 (-0.1%) |
39.75 |
39.17 - 40.04 |
0.7437 times |
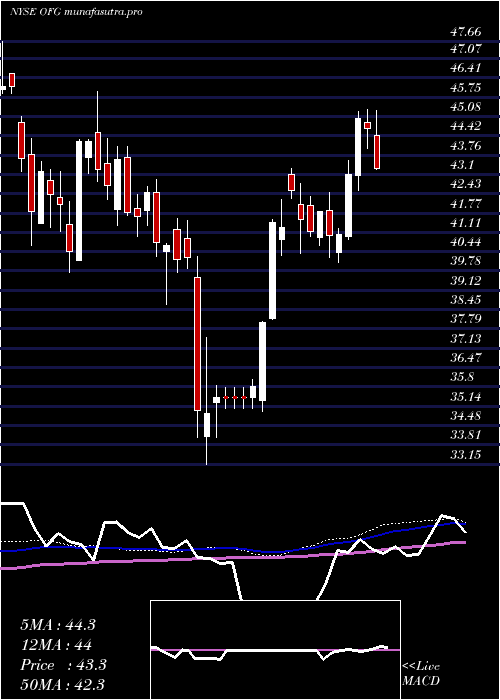
Weekly price and charts OfgBancorp Strong weekly Stock price targets for OfgBancorp OFG are 40.16 and 41.46 | Weekly Target 1 | 39.15 | | Weekly Target 2 | 39.87 | | Weekly Target 3 | 40.453333333333 | | Weekly Target 4 | 41.17 | | Weekly Target 5 | 41.75 |
Weekly price and volumes for Ofg Bancorp
| Date |
Closing |
Open |
Range |
Volume |
Thu 04 December 2025 |
40.58 (2.14%) |
39.75 |
39.74 - 41.04 |
0.6135 times |
Fri 28 November 2025 |
39.73 (-0.15%) |
39.63 |
39.19 - 40.52 |
0.8498 times |
Fri 21 November 2025 |
39.79 (-1.58%) |
40.29 |
39.07 - 40.61 |
1.565 times |
Fri 14 November 2025 |
40.43 (-0.3%) |
40.64 |
40.01 - 41.22 |
1.112 times |
Fri 07 November 2025 |
40.55 (4.89%) |
38.88 |
38.70 - 40.59 |
0.9112 times |
Fri 31 October 2025 |
38.66 (0%) |
38.16 |
37.99 - 38.90 |
0.3445 times |
Fri 31 October 2025 |
38.66 (-2.45%) |
39.57 |
37.89 - 39.81 |
2.0808 times |
Fri 24 October 2025 |
39.63 (-4.02%) |
41.42 |
38.95 - 42.76 |
1.1837 times |
Fri 17 October 2025 |
41.29 (-2.34%) |
41.79 |
40.32 - 43.42 |
1.0725 times |
Tue 07 October 2025 |
42.28 (-0.87%) |
43.09 |
42.27 - 43.59 |
0.267 times |
Fri 03 October 2025 |
42.65 (-4.54%) |
44.66 |
42.18 - 44.71 |
0.816 times |
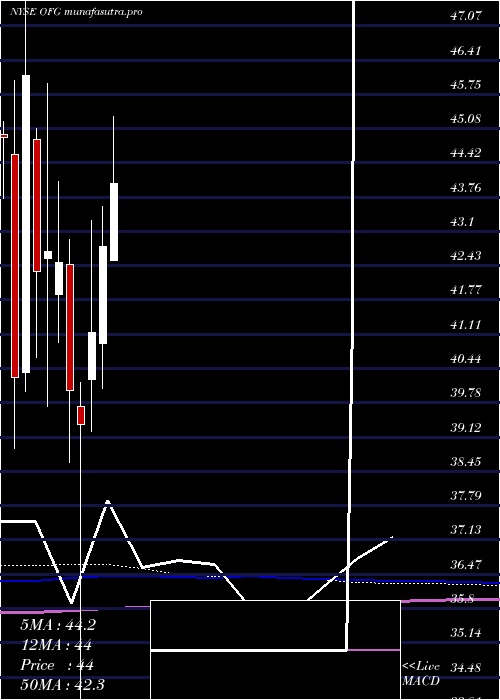
Monthly price and charts OfgBancorp Strong monthly Stock price targets for OfgBancorp OFG are 40.16 and 41.46 | Monthly Target 1 | 39.15 | | Monthly Target 2 | 39.87 | | Monthly Target 3 | 40.453333333333 | | Monthly Target 4 | 41.17 | | Monthly Target 5 | 41.75 |
Monthly price and volumes Ofg Bancorp
| Date |
Closing |
Open |
Range |
Volume |
Thu 04 December 2025 |
40.58 (2.14%) |
39.75 |
39.74 - 41.04 |
0.122 times |
Fri 28 November 2025 |
39.73 (2.77%) |
38.88 |
38.70 - 41.22 |
0.8827 times |
Fri 31 October 2025 |
38.66 (-11.11%) |
43.10 |
37.89 - 43.59 |
1.0889 times |
Tue 30 September 2025 |
43.49 (-2.82%) |
44.28 |
42.67 - 45.82 |
0.8744 times |
Fri 29 August 2025 |
44.75 (5%) |
42.15 |
41.10 - 45.18 |
0.8809 times |
Thu 31 July 2025 |
42.62 (-0.42%) |
42.54 |
42.00 - 46.11 |
0.9241 times |
Mon 30 June 2025 |
42.80 (4.04%) |
40.93 |
40.06 - 43.58 |
0.9274 times |
Fri 30 May 2025 |
41.14 (4.55%) |
40.23 |
39.22 - 43.31 |
1.0058 times |
Wed 30 April 2025 |
39.35 (-1.67%) |
39.71 |
33.15 - 40.18 |
1.2235 times |
Mon 31 March 2025 |
40.02 (-5.81%) |
42.46 |
38.62 - 42.93 |
2.0703 times |
Fri 28 February 2025 |
42.49 (-0.52%) |
41.88 |
40.95 - 44.06 |
1.2061 times |
DMA SMA EMA moving averages of Ofg Bancorp OFG
DMA (daily moving average) of Ofg Bancorp OFG
| DMA period | DMA value | | 5 day DMA | 40.24 | | 12 day DMA | 39.93 | | 20 day DMA | 40.11 | | 35 day DMA | 39.97 | | 50 day DMA | 41.01 | | 100 day DMA | 42.39 | | 150 day DMA | 42.26 | | 200 day DMA | 41.43 | EMA (exponential moving average) of Ofg Bancorp OFG
| EMA period | EMA current | EMA prev | EMA prev2 | | 5 day EMA | 40.33 | 40.2 | 39.96 | | 12 day EMA | 40.12 | 40.04 | 39.92 | | 20 day EMA | 40.14 | 40.09 | 40.03 | | 35 day EMA | 40.67 | 40.68 | 40.68 | | 50 day EMA | 41.18 | 41.2 | 41.22 |
SMA (simple moving average) of Ofg Bancorp OFG
| SMA period | SMA current | SMA prev | SMA prev2 | | 5 day SMA | 40.24 | 40.12 | 40.01 | | 12 day SMA | 39.93 | 39.82 | 39.8 | | 20 day SMA | 40.11 | 40.08 | 40.02 | | 35 day SMA | 39.97 | 40.03 | 40.11 | | 50 day SMA | 41.01 | 41.08 | 41.17 | | 100 day SMA | 42.39 | 42.43 | 42.47 | | 150 day SMA | 42.26 | 42.24 | 42.22 | | 200 day SMA | 41.43 | 41.44 | 41.45 |
|
|
