OilDri ODC full analysis,charts,indicators,moving averages,SMA,DMA,EMA,ADX,MACD,RSIOil Dri ODC WideScreen charts, DMA,SMA,EMA technical analysis, forecast prediction, by indicators ADX,MACD,RSI,CCI NYSE stock exchange
operates under Consumer Durables sector & deals in Miscellaneous Manufacturing Industries
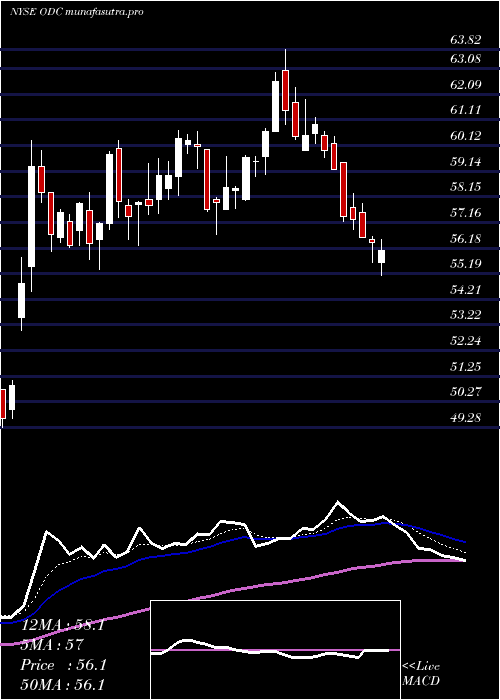
Daily price and charts and targets OilDri Strong Daily Stock price targets for OilDri ODC are 58.04 and 59.91 | Daily Target 1 | 57.7 | | Daily Target 2 | 58.38 | | Daily Target 3 | 59.566666666667 | | Daily Target 4 | 60.25 | | Daily Target 5 | 61.44 |
Daily price and volume Oil Dri
| Date |
Closing |
Open |
Range |
Volume |
Mon 20 October 2025 |
59.07 (-1.53%) |
60.50 |
58.88 - 60.75 |
1.2613 times |
Fri 17 October 2025 |
59.99 (1.52%) |
59.26 |
59.26 - 60.27 |
1.1307 times |
Thu 16 October 2025 |
59.09 (-0.86%) |
59.45 |
59.02 - 60.15 |
1.0534 times |
Wed 15 October 2025 |
59.60 (-0.62%) |
59.95 |
59.60 - 61.03 |
1.1531 times |
Tue 14 October 2025 |
59.97 (-2.82%) |
61.10 |
59.77 - 62.23 |
1.0585 times |
Mon 13 October 2025 |
61.71 (0.47%) |
65.02 |
60.96 - 66.03 |
1.8679 times |
Tue 07 October 2025 |
61.42 (1.77%) |
60.64 |
60.12 - 61.52 |
0.9125 times |
Mon 06 October 2025 |
60.35 (-0.48%) |
60.58 |
60.12 - 61.91 |
0.4184 times |
Fri 03 October 2025 |
60.64 (0.15%) |
60.98 |
60.40 - 62.00 |
0.6358 times |
Thu 02 October 2025 |
60.55 (0.08%) |
60.36 |
59.22 - 60.89 |
0.5084 times |
Wed 01 October 2025 |
60.50 (-0.88%) |
60.50 |
60.01 - 61.12 |
0.8059 times |
Weekly price and charts OilDri Strong weekly Stock price targets for OilDri ODC are 58.04 and 59.91 | Weekly Target 1 | 57.7 | | Weekly Target 2 | 58.38 | | Weekly Target 3 | 59.566666666667 | | Weekly Target 4 | 60.25 | | Weekly Target 5 | 61.44 |
Weekly price and volumes for Oil Dri
| Date |
Closing |
Open |
Range |
Volume |
Mon 20 October 2025 |
59.07 (-1.53%) |
60.50 |
58.88 - 60.75 |
0.3082 times |
Fri 17 October 2025 |
59.99 (-2.33%) |
65.02 |
59.02 - 66.03 |
1.5303 times |
Tue 07 October 2025 |
61.42 (1.29%) |
60.58 |
60.12 - 61.91 |
0.3251 times |
Fri 03 October 2025 |
60.64 (-2.62%) |
62.25 |
59.22 - 62.25 |
0.8131 times |
Fri 26 September 2025 |
62.27 (-4.76%) |
65.12 |
62.00 - 65.12 |
1.1012 times |
Fri 19 September 2025 |
65.38 (-0.24%) |
65.84 |
65.38 - 69.76 |
1.6063 times |
Fri 12 September 2025 |
65.54 (2.74%) |
63.92 |
63.92 - 66.93 |
1.2473 times |
Fri 05 September 2025 |
63.79 (7.43%) |
59.16 |
59.00 - 65.03 |
1.1361 times |
Fri 29 August 2025 |
59.38 (0%) |
59.27 |
58.74 - 59.42 |
0.144 times |
Fri 29 August 2025 |
59.38 (0.49%) |
58.81 |
57.75 - 59.42 |
1.7885 times |
Fri 22 August 2025 |
59.09 (-0.61%) |
59.23 |
57.50 - 60.34 |
1.4744 times |

Monthly price and charts OilDri Strong monthly Stock price targets for OilDri ODC are 55.4 and 62.55 | Monthly Target 1 | 54.18 | | Monthly Target 2 | 56.62 | | Monthly Target 3 | 61.326666666667 | | Monthly Target 4 | 63.77 | | Monthly Target 5 | 68.48 |
Monthly price and volumes Oil Dri
| Date |
Closing |
Open |
Range |
Volume |
Mon 20 October 2025 |
59.07 (-3.23%) |
60.50 |
58.88 - 66.03 |
0.6303 times |
Tue 30 September 2025 |
61.04 (2.8%) |
59.16 |
59.00 - 69.76 |
1.2958 times |
Fri 29 August 2025 |
59.38 (5.28%) |
55.63 |
55.11 - 63.00 |
1.5166 times |
Thu 31 July 2025 |
56.40 (-4.39%) |
58.48 |
55.63 - 63.82 |
1.5243 times |
Mon 30 June 2025 |
58.99 (17.58%) |
50.25 |
49.28 - 60.32 |
1.5001 times |
Fri 30 May 2025 |
50.17 (19.2%) |
42.15 |
41.50 - 50.49 |
0.6667 times |
Wed 30 April 2025 |
42.09 (-8.34%) |
46.26 |
41.37 - 46.93 |
0.6387 times |
Mon 31 March 2025 |
45.92 (4.1%) |
44.11 |
43.77 - 49.72 |
1.0885 times |
Fri 28 February 2025 |
44.11 (4.97%) |
41.71 |
41.37 - 44.85 |
0.4687 times |
Fri 31 January 2025 |
42.02 (-52.05%) |
88.65 |
40.66 - 88.65 |
0.6704 times |
Tue 31 December 2024 |
87.64 (25.99%) |
67.88 |
67.88 - 93.00 |
0.5331 times |

DMA SMA EMA moving averages of Oil Dri ODC
DMA (daily moving average) of Oil Dri ODC
| DMA period | DMA value | | 5 day DMA | 59.54 | | 12 day DMA | 60.33 | | 20 day DMA | 61.68 | | 35 day DMA | 62.62 | | 50 day DMA | 61.52 | | 100 day DMA | 59.1 | | 150 day DMA | 54.32 | | 200 day DMA | 52.02 | EMA (exponential moving average) of Oil Dri ODC
| EMA period | EMA current | EMA prev | EMA prev2 | | 5 day EMA | 59.67 | 59.97 | 59.96 | | 12 day EMA | 60.48 | 60.74 | 60.88 | | 20 day EMA | 61.12 | 61.34 | 61.48 | | 35 day EMA | 60.98 | 61.09 | 61.16 | | 50 day EMA | 60.93 | 61.01 | 61.05 |
SMA (simple moving average) of Oil Dri ODC
| SMA period | SMA current | SMA prev | SMA prev2 | | 5 day SMA | 59.54 | 60.07 | 60.36 | | 12 day SMA | 60.33 | 60.45 | 60.64 | | 20 day SMA | 61.68 | 62.11 | 62.5 | | 35 day SMA | 62.62 | 62.6 | 62.57 | | 50 day SMA | 61.52 | 61.49 | 61.43 | | 100 day SMA | 59.1 | 58.99 | 58.87 | | 150 day SMA | 54.32 | 54.24 | 54.17 | | 200 day SMA | 52.02 | 52.16 | 52.3 |
|
|
