OwensCorning OC full analysis,charts,indicators,moving averages,SMA,DMA,EMA,ADX,MACD,RSIOwens Corning OC WideScreen charts, DMA,SMA,EMA technical analysis, forecast prediction, by indicators ADX,MACD,RSI,CCI NYSE stock exchange
operates under Capital Goods sector & deals in Industrial Machinery Components
Daily price and charts and targets OwensCorning Strong Daily Stock price targets for OwensCorning OC are 128.36 and 134.86 | Daily Target 1 | 123.24 | | Daily Target 2 | 126.97 | | Daily Target 3 | 129.74333333333 | | Daily Target 4 | 133.47 | | Daily Target 5 | 136.24 |
Daily price and volume Owens Corning
| Date |
Closing |
Open |
Range |
Volume |
Tue 21 October 2025 |
130.69 (2.49%) |
127.13 |
126.02 - 132.52 |
1.31 times |
Mon 20 October 2025 |
127.52 (0.44%) |
126.93 |
126.58 - 128.20 |
1.0512 times |
Fri 17 October 2025 |
126.96 (0.52%) |
125.55 |
124.67 - 127.51 |
1.3712 times |
Thu 16 October 2025 |
126.30 (-0.77%) |
128.16 |
125.57 - 128.55 |
0.6842 times |
Wed 15 October 2025 |
127.28 (-0.76%) |
130.36 |
127.27 - 131.11 |
0.7576 times |
Tue 14 October 2025 |
128.26 (2.34%) |
124.54 |
123.23 - 128.61 |
1.1291 times |
Mon 13 October 2025 |
125.33 (-6.04%) |
127.63 |
125.13 - 128.42 |
1.2217 times |
Tue 07 October 2025 |
133.38 (-2.46%) |
136.55 |
132.66 - 136.92 |
0.9886 times |
Mon 06 October 2025 |
136.75 (-1.42%) |
139.79 |
135.69 - 139.79 |
0.4585 times |
Fri 03 October 2025 |
138.72 (-1.53%) |
141.00 |
138.30 - 142.55 |
1.0279 times |
Thu 02 October 2025 |
140.88 (-0.3%) |
141.00 |
140.02 - 143.47 |
0.358 times |
Weekly price and charts OwensCorning Strong weekly Stock price targets for OwensCorning OC are 128.36 and 134.86 | Weekly Target 1 | 123.24 | | Weekly Target 2 | 126.97 | | Weekly Target 3 | 129.74333333333 | | Weekly Target 4 | 133.47 | | Weekly Target 5 | 136.24 |
Weekly price and volumes for Owens Corning
| Date |
Closing |
Open |
Range |
Volume |
Tue 21 October 2025 |
130.69 (2.94%) |
126.93 |
126.02 - 132.52 |
0.733 times |
Fri 17 October 2025 |
126.96 (-4.81%) |
127.63 |
123.23 - 131.11 |
1.603 times |
Tue 07 October 2025 |
133.38 (-3.85%) |
139.79 |
132.66 - 139.79 |
0.4492 times |
Fri 03 October 2025 |
138.72 (-3.07%) |
143.74 |
138.30 - 144.04 |
1.1517 times |
Fri 26 September 2025 |
143.12 (-1.68%) |
145.00 |
139.13 - 147.00 |
1.1915 times |
Fri 19 September 2025 |
145.57 (-4.41%) |
153.03 |
144.59 - 155.08 |
1.3976 times |
Fri 12 September 2025 |
152.28 (-2.13%) |
155.16 |
148.61 - 157.75 |
1.2412 times |
Fri 05 September 2025 |
155.59 (3.61%) |
147.01 |
146.62 - 159.42 |
0.9135 times |
Fri 29 August 2025 |
150.17 (0%) |
152.93 |
149.30 - 153.84 |
0.2113 times |
Fri 29 August 2025 |
150.17 (-3.59%) |
154.30 |
149.30 - 155.12 |
1.108 times |
Fri 22 August 2025 |
155.76 (3.65%) |
150.27 |
146.76 - 157.86 |
1.1456 times |
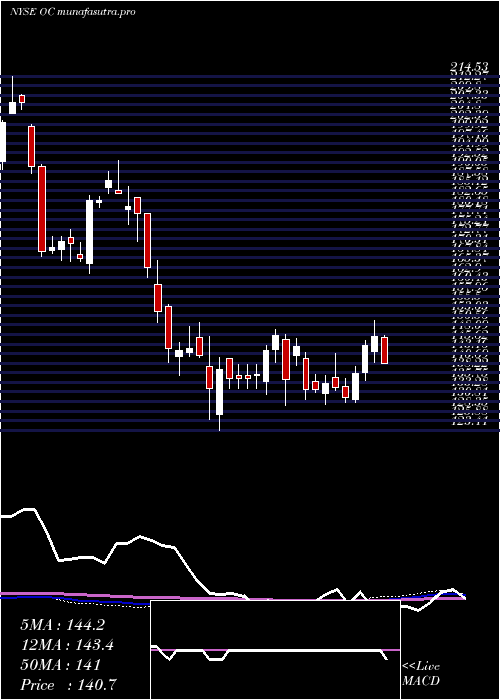
Monthly price and charts OwensCorning Strong monthly Stock price targets for OwensCorning OC are 116.84 and 137.08 | Monthly Target 1 | 112.22 | | Monthly Target 2 | 121.46 | | Monthly Target 3 | 132.46333333333 | | Monthly Target 4 | 141.7 | | Monthly Target 5 | 152.7 |
Monthly price and volumes Owens Corning
| Date |
Closing |
Open |
Range |
Volume |
Tue 21 October 2025 |
130.69 (-7.61%) |
140.77 |
123.23 - 143.47 |
0.7623 times |
Tue 30 September 2025 |
141.46 (-5.8%) |
147.01 |
138.83 - 159.42 |
1.1572 times |
Fri 29 August 2025 |
150.17 (7.7%) |
137.28 |
135.08 - 157.86 |
1.0644 times |
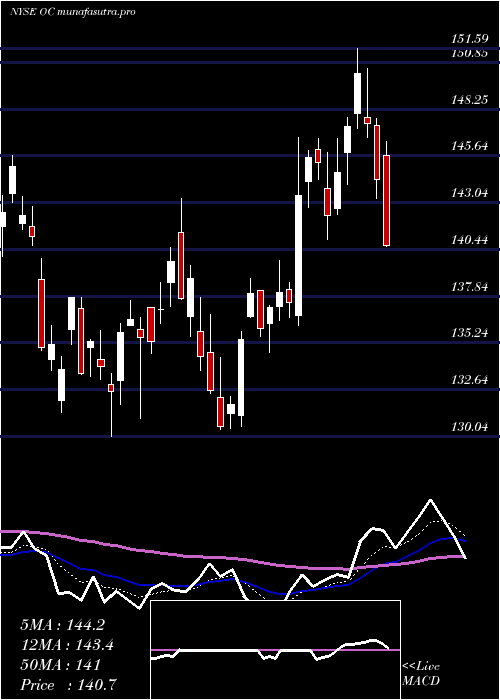
Thu 31 July 2025 |
139.43 (1.39%) |
136.75 |
136.23 - 151.59 |
0.8805 times |
Mon 30 June 2025 |
137.52 (2.67%) |
132.95 |
130.04 - 143.27 |
0.9612 times |
Fri 30 May 2025 |
133.95 (-7.88%) |
144.71 |
129.81 - 149.51 |
1.0883 times |
Wed 30 April 2025 |
145.41 (1.81%) |
142.76 |
123.41 - 147.45 |
0.9923 times |
Mon 31 March 2025 |
142.82 (-7.28%) |
155.37 |
137.50 - 155.91 |
1.2896 times |
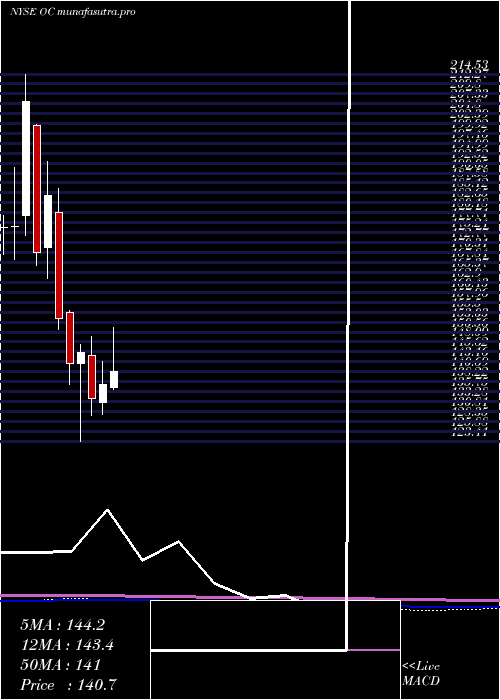
Fri 28 February 2025 |
154.04 (-16.53%) |
180.28 |
151.20 - 186.18 |
1.0077 times |
Fri 31 January 2025 |
184.55 (8.35%) |
171.58 |
163.89 - 192.96 |
0.7966 times |
Tue 31 December 2024 |
170.32 (-18.09%) |
201.83 |
167.15 - 202.20 |
0.9251 times |
DMA SMA EMA moving averages of Owens Corning OC
DMA (daily moving average) of Owens Corning OC
| DMA period | DMA value | | 5 day DMA | 127.75 | | 12 day DMA | 131.95 | | 20 day DMA | 136.3 | | 35 day DMA | 142.71 | | 50 day DMA | 145.09 | | 100 day DMA | 142.42 | | 150 day DMA | 141.86 | | 200 day DMA | 149.15 | EMA (exponential moving average) of Owens Corning OC
| EMA period | EMA current | EMA prev | EMA prev2 | | 5 day EMA | 128.9 | 128.01 | 128.25 | | 12 day EMA | 131.8 | 132 | 132.81 | | 20 day EMA | 135.2 | 135.68 | 136.54 | | 35 day EMA | 139.16 | 139.66 | 140.37 | | 50 day EMA | 143.15 | 143.66 | 144.32 |
SMA (simple moving average) of Owens Corning OC
| SMA period | SMA current | SMA prev | SMA prev2 | | 5 day SMA | 127.75 | 127.26 | 126.83 | | 12 day SMA | 131.95 | 132.85 | 133.97 | | 20 day SMA | 136.3 | 137.15 | 138.07 | | 35 day SMA | 142.71 | 143.33 | 144.05 | | 50 day SMA | 145.09 | 145.42 | 145.83 | | 100 day SMA | 142.42 | 142.46 | 142.54 | | 150 day SMA | 141.86 | 141.94 | 142.02 | | 200 day SMA | 149.15 | 149.34 | 149.56 |
|
|
