NuveenInsured NXC full analysis,charts,indicators,moving averages,SMA,DMA,EMA,ADX,MACD,RSINuveen Insured NXC WideScreen charts, DMA,SMA,EMA technical analysis, forecast prediction, by indicators ADX,MACD,RSI,CCI NYSE stock exchange
operates under N A sector & deals in N A
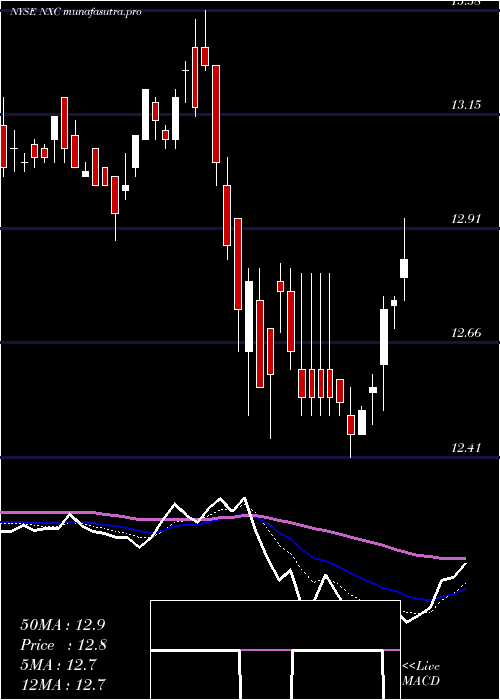
Daily price and charts and targets NuveenInsured Strong Daily Stock price targets for NuveenInsured NXC are 13.22 and 13.27 | Daily Target 1 | 13.18 | | Daily Target 2 | 13.2 | | Daily Target 3 | 13.226666666667 | | Daily Target 4 | 13.25 | | Daily Target 5 | 13.28 |
Daily price and volume Nuveen Insured
| Date |
Closing |
Open |
Range |
Volume |
Fri 05 December 2025 |
13.23 (-0.08%) |
13.20 |
13.20 - 13.25 |
1.6453 times |
Thu 04 December 2025 |
13.24 (0.23%) |
13.20 |
13.20 - 13.26 |
1.3644 times |
Wed 03 December 2025 |
13.21 (-0.23%) |
13.16 |
13.16 - 13.30 |
1.5811 times |
Tue 02 December 2025 |
13.24 (0%) |
13.19 |
13.15 - 13.24 |
1.4848 times |
Mon 01 December 2025 |
13.24 (0.3%) |
13.23 |
13.18 - 13.24 |
1.4125 times |
Fri 28 November 2025 |
13.20 (-0.15%) |
13.16 |
13.16 - 13.26 |
0.2087 times |
Wed 26 November 2025 |
13.22 (-0.15%) |
13.18 |
13.18 - 13.27 |
0.4254 times |
Tue 25 November 2025 |
13.24 (0.15%) |
13.30 |
13.18 - 13.30 |
0.4093 times |
Mon 24 November 2025 |
13.22 (0.15%) |
13.25 |
13.14 - 13.25 |
0.6019 times |
Fri 21 November 2025 |
13.20 (0.38%) |
13.13 |
13.13 - 13.27 |
0.8668 times |
Thu 20 November 2025 |
13.15 (-0.45%) |
13.20 |
13.14 - 13.27 |
2.3515 times |
Weekly price and charts NuveenInsured Strong weekly Stock price targets for NuveenInsured NXC are 13.16 and 13.31 | Weekly Target 1 | 13.08 | | Weekly Target 2 | 13.15 | | Weekly Target 3 | 13.226666666667 | | Weekly Target 4 | 13.3 | | Weekly Target 5 | 13.38 |
Weekly price and volumes for Nuveen Insured
| Date |
Closing |
Open |
Range |
Volume |
Fri 05 December 2025 |
13.23 (0.23%) |
13.23 |
13.15 - 13.30 |
0.9757 times |
Fri 28 November 2025 |
13.20 (0%) |
13.25 |
13.14 - 13.30 |
0.2144 times |
Fri 21 November 2025 |
13.20 (-0.68%) |
13.30 |
13.13 - 13.30 |
0.5825 times |
Fri 14 November 2025 |
13.29 (0.53%) |
13.18 |
13.18 - 13.37 |
0.8816 times |
Fri 07 November 2025 |
13.22 (-0.08%) |
13.28 |
13.18 - 13.45 |
1.4286 times |
Fri 31 October 2025 |
13.23 (0%) |
13.10 |
13.10 - 13.23 |
0.5626 times |
Fri 31 October 2025 |
13.23 (1.38%) |
13.10 |
13.01 - 13.23 |
1.5676 times |
Fri 24 October 2025 |
13.05 (0.31%) |
13.00 |
12.96 - 13.06 |
1.6555 times |
Fri 17 October 2025 |
13.01 (-0.31%) |
13.02 |
12.98 - 13.15 |
0.6568 times |
Fri 10 October 2025 |
13.05 (0.69%) |
12.95 |
12.93 - 13.15 |
1.4747 times |
Fri 03 October 2025 |
12.96 (0.15%) |
12.94 |
12.94 - 13.04 |
0.7353 times |
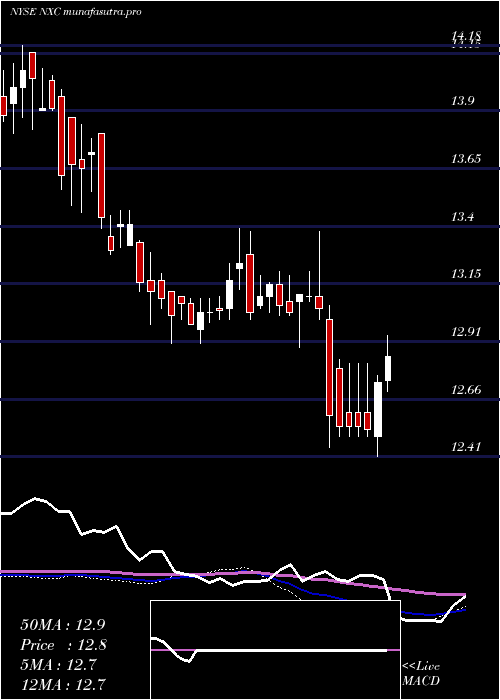
Monthly price and charts NuveenInsured Strong monthly Stock price targets for NuveenInsured NXC are 13.16 and 13.31 | Monthly Target 1 | 13.08 | | Monthly Target 2 | 13.15 | | Monthly Target 3 | 13.226666666667 | | Monthly Target 4 | 13.3 | | Monthly Target 5 | 13.38 |
Monthly price and volumes Nuveen Insured
| Date |
Closing |
Open |
Range |
Volume |
Fri 05 December 2025 |
13.23 (0.23%) |
13.23 |
13.15 - 13.30 |
0.242 times |
Fri 28 November 2025 |
13.20 (-0.23%) |
13.28 |
13.13 - 13.45 |
0.7705 times |
Fri 31 October 2025 |
13.23 (1.93%) |
13.01 |
12.93 - 13.23 |
1.5837 times |
Tue 30 September 2025 |
12.98 (1.01%) |
12.83 |
12.75 - 13.05 |
1.1461 times |
Fri 29 August 2025 |
12.85 (0.16%) |
12.83 |
12.71 - 12.95 |
0.7861 times |
Thu 31 July 2025 |
12.83 (-2.58%) |
13.20 |
12.71 - 13.20 |
1.0108 times |
Mon 30 June 2025 |
13.17 (3.86%) |
12.71 |
12.68 - 13.17 |
0.9116 times |
Fri 30 May 2025 |
12.68 (-1.32%) |
12.92 |
12.66 - 13.16 |
1.1235 times |
Wed 30 April 2025 |
12.85 (-2.58%) |
13.25 |
12.41 - 13.38 |
1.6555 times |
Mon 31 March 2025 |
13.19 (0.3%) |
13.15 |
12.88 - 13.21 |
0.7701 times |
Fri 28 February 2025 |
13.15 (-0.15%) |
13.22 |
13.00 - 13.39 |
0.984 times |

DMA SMA EMA moving averages of Nuveen Insured NXC
DMA (daily moving average) of Nuveen Insured NXC
| DMA period | DMA value | | 5 day DMA | 13.23 | | 12 day DMA | 13.22 | | 20 day DMA | 13.24 | | 35 day DMA | 13.19 | | 50 day DMA | 13.14 | | 100 day DMA | 13.01 | | 150 day DMA | 12.97 | | 200 day DMA | 12.96 | EMA (exponential moving average) of Nuveen Insured NXC
| EMA period | EMA current | EMA prev | EMA prev2 | | 5 day EMA | 13.23 | 13.23 | 13.22 | | 12 day EMA | 13.23 | 13.23 | 13.23 | | 20 day EMA | 13.21 | 13.21 | 13.21 | | 35 day EMA | 13.16 | 13.16 | 13.16 | | 50 day EMA | 13.12 | 13.12 | 13.12 |
SMA (simple moving average) of Nuveen Insured NXC
| SMA period | SMA current | SMA prev | SMA prev2 | | 5 day SMA | 13.23 | 13.23 | 13.22 | | 12 day SMA | 13.22 | 13.22 | 13.22 | | 20 day SMA | 13.24 | 13.25 | 13.26 | | 35 day SMA | 13.19 | 13.19 | 13.18 | | 50 day SMA | 13.14 | 13.14 | 13.13 | | 100 day SMA | 13.01 | 13 | 13 | | 150 day SMA | 12.97 | 12.96 | 12.96 | | 200 day SMA | 12.96 | 12.95 | 12.95 |
|
|
