QuanexBuilding NX full analysis,charts,indicators,moving averages,SMA,DMA,EMA,ADX,MACD,RSIQuanex Building NX WideScreen charts, DMA,SMA,EMA technical analysis, forecast prediction, by indicators ADX,MACD,RSI,CCI NYSE stock exchange
operates under Capital Goods sector & deals in Metal Fabrications
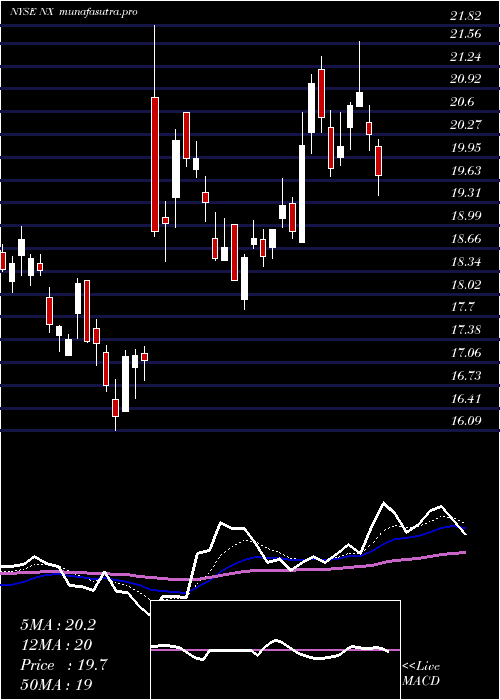
Daily price and charts and targets QuanexBuilding Strong Daily Stock price targets for QuanexBuilding NX are 13.46 and 13.86 | Daily Target 1 | 13.25 | | Daily Target 2 | 13.45 | | Daily Target 3 | 13.646666666667 | | Daily Target 4 | 13.85 | | Daily Target 5 | 14.05 |
Daily price and volume Quanex Building
| Date |
Closing |
Open |
Range |
Volume |
Thu 04 December 2025 |
13.66 (-0.29%) |
13.66 |
13.44 - 13.84 |
0.9552 times |
Wed 03 December 2025 |
13.70 (3.24%) |
13.35 |
13.26 - 14.01 |
0.9862 times |
Tue 02 December 2025 |
13.27 (1.38%) |
13.24 |
12.99 - 13.39 |
0.7293 times |
Mon 01 December 2025 |
13.09 (1%) |
12.78 |
12.68 - 13.41 |
1.1185 times |
Fri 28 November 2025 |
12.96 (0.7%) |
12.95 |
12.81 - 13.06 |
0.3929 times |
Wed 26 November 2025 |
12.87 (2.71%) |
12.35 |
12.33 - 13.13 |
1.3993 times |
Tue 25 November 2025 |
12.53 (3.13%) |
12.28 |
12.18 - 12.80 |
1.0199 times |
Mon 24 November 2025 |
12.15 (1.33%) |
11.90 |
11.74 - 12.34 |
1.3171 times |
Fri 21 November 2025 |
11.99 (6.58%) |
11.43 |
11.37 - 12.12 |
1.2481 times |
Thu 20 November 2025 |
11.25 (-0.88%) |
11.53 |
11.16 - 11.64 |
0.8334 times |
Wed 19 November 2025 |
11.35 (-4.78%) |
11.89 |
11.04 - 12.23 |
0.9093 times |
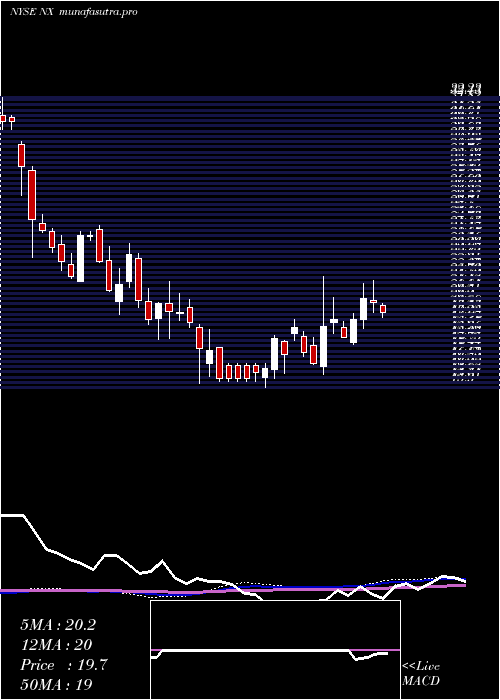
Weekly price and charts QuanexBuilding Strong weekly Stock price targets for QuanexBuilding NX are 13.17 and 14.5 | Weekly Target 1 | 12.12 | | Weekly Target 2 | 12.89 | | Weekly Target 3 | 13.45 | | Weekly Target 4 | 14.22 | | Weekly Target 5 | 14.78 |
Weekly price and volumes for Quanex Building
| Date |
Closing |
Open |
Range |
Volume |
Thu 04 December 2025 |
13.66 (5.4%) |
12.78 |
12.68 - 14.01 |
1.2139 times |
Fri 28 November 2025 |
12.96 (8.09%) |
11.90 |
11.74 - 13.13 |
1.3228 times |
Fri 21 November 2025 |
11.99 (-7.41%) |
12.96 |
11.04 - 12.96 |
1.4613 times |
Fri 14 November 2025 |
12.95 (-0.84%) |
13.28 |
12.63 - 13.51 |
0.8346 times |
Fri 07 November 2025 |
13.06 (-8.09%) |
13.86 |
12.84 - 13.90 |
0.9223 times |
Fri 31 October 2025 |
14.21 (0%) |
14.19 |
13.92 - 14.29 |
0.2366 times |
Fri 31 October 2025 |
14.21 (-8.38%) |
15.60 |
13.92 - 15.83 |
1.0817 times |
Fri 24 October 2025 |
15.51 (6.09%) |
14.70 |
14.65 - 15.65 |
1.3007 times |
Fri 17 October 2025 |
14.62 (1.6%) |
13.66 |
13.11 - 14.70 |
1.1922 times |
Tue 07 October 2025 |
14.39 (-2.31%) |
14.82 |
14.22 - 14.93 |
0.4339 times |
Fri 03 October 2025 |
14.73 (6.74%) |
13.87 |
13.36 - 14.96 |
1.2791 times |
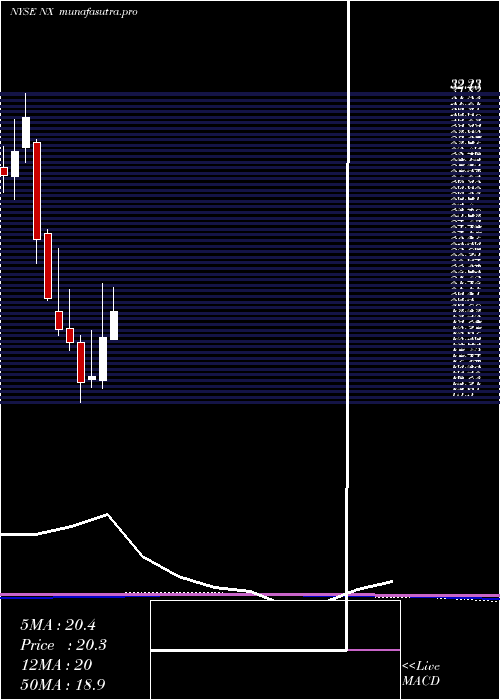
Monthly price and charts QuanexBuilding Strong monthly Stock price targets for QuanexBuilding NX are 13.17 and 14.5 | Monthly Target 1 | 12.12 | | Monthly Target 2 | 12.89 | | Monthly Target 3 | 13.45 | | Monthly Target 4 | 14.22 | | Monthly Target 5 | 14.78 |
Monthly price and volumes Quanex Building
| Date |
Closing |
Open |
Range |
Volume |
Thu 04 December 2025 |
13.66 (5.4%) |
12.78 |
12.68 - 14.01 |
0.2911 times |
Fri 28 November 2025 |
12.96 (-8.8%) |
13.86 |
11.04 - 13.90 |
1.0887 times |
Fri 31 October 2025 |
14.21 (-0.07%) |
14.12 |
13.11 - 15.83 |
1.1949 times |
Tue 30 September 2025 |
14.22 (-33.15%) |
20.81 |
13.22 - 21.21 |
1.796 times |
Fri 29 August 2025 |
21.27 (9.19%) |
19.16 |
18.92 - 22.81 |
0.804 times |
Thu 31 July 2025 |
19.48 (3.07%) |
18.75 |
18.08 - 21.59 |
0.893 times |
Mon 30 June 2025 |
18.90 (12.97%) |
16.53 |
16.09 - 21.82 |
1.1423 times |
Fri 30 May 2025 |
16.73 (1.76%) |
16.59 |
16.13 - 19.27 |
0.6813 times |
Wed 30 April 2025 |
16.44 (-11.57%) |
18.59 |
15.30 - 18.98 |
0.867 times |
Mon 31 March 2025 |
18.59 (-3.63%) |
19.36 |
18.14 - 21.51 |
1.2417 times |
Fri 28 February 2025 |
19.29 (-8.14%) |
20.31 |
18.99 - 23.72 |
0.938 times |
DMA SMA EMA moving averages of Quanex Building NX
DMA (daily moving average) of Quanex Building NX
| DMA period | DMA value | | 5 day DMA | 13.34 | | 12 day DMA | 12.56 | | 20 day DMA | 12.73 | | 35 day DMA | 13.53 | | 50 day DMA | 13.71 | | 100 day DMA | 16.44 | | 150 day DMA | 17.09 | | 200 day DMA | 17.47 | EMA (exponential moving average) of Quanex Building NX
| EMA period | EMA current | EMA prev | EMA prev2 | | 5 day EMA | 13.35 | 13.19 | 12.93 | | 12 day EMA | 13.02 | 12.9 | 12.75 | | 20 day EMA | 13.04 | 12.98 | 12.9 | | 35 day EMA | 13.29 | 13.27 | 13.24 | | 50 day EMA | 13.76 | 13.76 | 13.76 |
SMA (simple moving average) of Quanex Building NX
| SMA period | SMA current | SMA prev | SMA prev2 | | 5 day SMA | 13.34 | 13.18 | 12.94 | | 12 day SMA | 12.56 | 12.44 | 12.38 | | 20 day SMA | 12.73 | 12.71 | 12.69 | | 35 day SMA | 13.53 | 13.54 | 13.56 | | 50 day SMA | 13.71 | 13.71 | 13.73 | | 100 day SMA | 16.44 | 16.52 | 16.59 | | 150 day SMA | 17.09 | 17.1 | 17.12 | | 200 day SMA | 17.47 | 17.51 | 17.55 |
|
|
