NventElectric NVT full analysis,charts,indicators,moving averages,SMA,DMA,EMA,ADX,MACD,RSINvent Electric NVT WideScreen charts, DMA,SMA,EMA technical analysis, forecast prediction, by indicators ADX,MACD,RSI,CCI NYSE stock exchange
operates under Technology sector & deals in Industrial Machinery Components
Daily price and charts and targets NventElectric Strong Daily Stock price targets for NventElectric NVT are 106.42 and 110.81 | Daily Target 1 | 102.85 | | Daily Target 2 | 105.6 | | Daily Target 3 | 107.24333333333 | | Daily Target 4 | 109.99 | | Daily Target 5 | 111.63 |
Daily price and volume Nvent Electric
| Date |
Closing |
Open |
Range |
Volume |
Thu 04 December 2025 |
108.34 (3.21%) |
105.01 |
104.50 - 108.89 |
0.3407 times |
Wed 03 December 2025 |
104.97 (-0.37%) |
104.12 |
102.25 - 105.07 |
0.7891 times |
Tue 02 December 2025 |
105.36 (-0.29%) |
107.06 |
104.98 - 107.31 |
1.0219 times |
Mon 01 December 2025 |
105.67 (-1.49%) |
105.66 |
104.60 - 106.54 |
0.7424 times |
Fri 28 November 2025 |
107.27 (0.69%) |
107.33 |
106.64 - 107.90 |
0.3453 times |
Wed 26 November 2025 |
106.53 (1.52%) |
105.50 |
105.44 - 107.70 |
0.705 times |
Tue 25 November 2025 |
104.93 (0.8%) |
103.68 |
100.74 - 105.47 |
1.0925 times |
Mon 24 November 2025 |
104.10 (3.53%) |
101.65 |
100.75 - 104.58 |
1.1708 times |
Fri 21 November 2025 |
100.55 (-0.96%) |
101.52 |
96.55 - 102.11 |
1.749 times |
Thu 20 November 2025 |
101.52 (-3.99%) |
109.86 |
100.60 - 111.19 |
2.0432 times |
Wed 19 November 2025 |
105.74 (1.37%) |
104.50 |
104.39 - 107.50 |
0.9195 times |
Weekly price and charts NventElectric Strong weekly Stock price targets for NventElectric NVT are 105.3 and 111.94 | Weekly Target 1 | 99.85 | | Weekly Target 2 | 104.1 | | Weekly Target 3 | 106.49333333333 | | Weekly Target 4 | 110.74 | | Weekly Target 5 | 113.13 |
Weekly price and volumes for Nvent Electric
| Date |
Closing |
Open |
Range |
Volume |
Thu 04 December 2025 |
108.34 (1%) |
105.66 |
102.25 - 108.89 |
0.7297 times |
Fri 28 November 2025 |
107.27 (6.68%) |
101.65 |
100.74 - 107.90 |
0.8355 times |
Fri 21 November 2025 |
100.55 (-5.63%) |
106.15 |
96.55 - 111.19 |
1.6822 times |
Fri 14 November 2025 |
106.55 (-4.03%) |
113.47 |
102.00 - 114.15 |
1.1533 times |
Fri 07 November 2025 |
111.03 (-2.9%) |
110.24 |
106.41 - 113.48 |
0.8574 times |
Fri 31 October 2025 |
114.35 (0%) |
113.00 |
111.25 - 117.52 |
0.4953 times |
Fri 31 October 2025 |
114.35 (11.82%) |
103.30 |
101.21 - 117.52 |
1.5976 times |
Fri 24 October 2025 |
102.26 (2.95%) |
99.95 |
95.15 - 104.30 |
1.1997 times |
Fri 17 October 2025 |
99.33 (3.47%) |
98.22 |
96.91 - 102.31 |
1.0858 times |
Tue 07 October 2025 |
96.00 (-1.84%) |
99.39 |
95.10 - 100.49 |
0.3634 times |
Fri 03 October 2025 |
97.80 (0.82%) |
98.01 |
96.21 - 101.77 |
0.7257 times |
Monthly price and charts NventElectric Strong monthly Stock price targets for NventElectric NVT are 105.3 and 111.94 | Monthly Target 1 | 99.85 | | Monthly Target 2 | 104.1 | | Monthly Target 3 | 106.49333333333 | | Monthly Target 4 | 110.74 | | Monthly Target 5 | 113.13 |
Monthly price and volumes Nvent Electric
| Date |
Closing |
Open |
Range |
Volume |
Thu 04 December 2025 |
108.34 (1%) |
105.66 |
102.25 - 108.89 |
0.1705 times |
Fri 28 November 2025 |
107.27 (-6.19%) |
110.24 |
96.55 - 114.15 |
1.058 times |
Fri 31 October 2025 |
114.35 (15.93%) |
97.88 |
95.10 - 117.52 |
1.2095 times |
Tue 30 September 2025 |
98.64 (9.13%) |
88.32 |
87.16 - 101.06 |
0.9565 times |
Fri 29 August 2025 |
90.39 (15.26%) |
88.46 |
84.99 - 92.95 |
1.047 times |
Thu 31 July 2025 |
78.42 (7.06%) |
72.67 |
68.90 - 80.75 |
1.165 times |
Mon 30 June 2025 |
73.25 (11.32%) |
65.57 |
63.60 - 74.75 |
0.7963 times |
Fri 30 May 2025 |
65.80 (19.83%) |
56.06 |
55.63 - 69.22 |
1.1694 times |
Wed 30 April 2025 |
54.91 (4.75%) |
52.23 |
41.71 - 55.78 |
1.2098 times |
Mon 31 March 2025 |
52.42 (-13.13%) |
60.97 |
50.14 - 61.50 |
1.218 times |
Fri 28 February 2025 |
60.34 (-7.3%) |
62.23 |
58.56 - 69.98 |
1.2009 times |

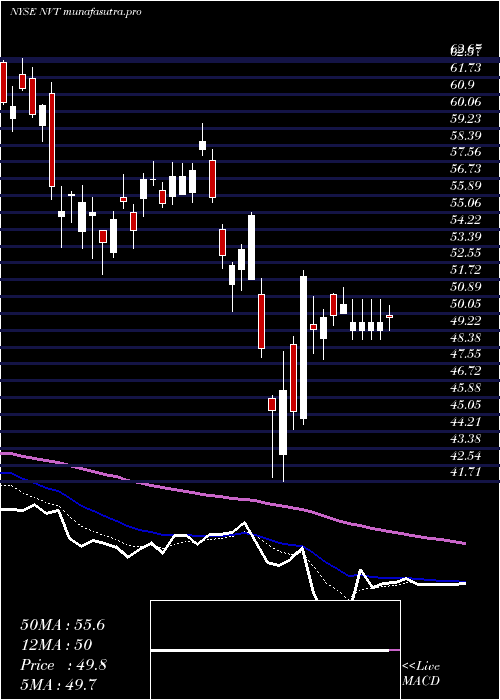
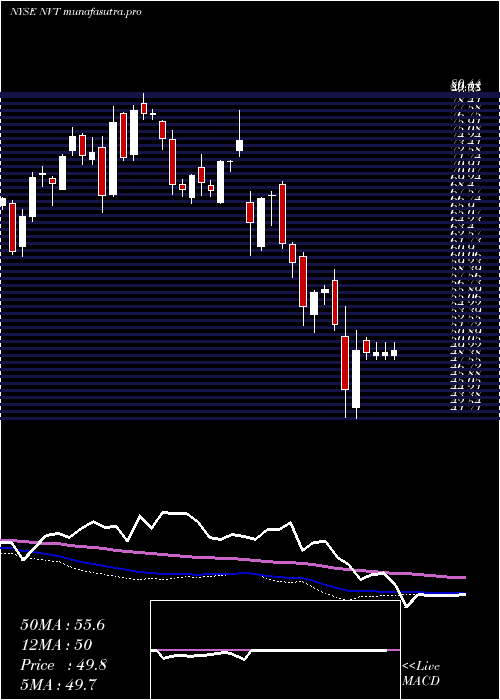
DMA SMA EMA moving averages of Nvent Electric NVT
DMA (daily moving average) of Nvent Electric NVT
| DMA period | DMA value | | 5 day DMA | 106.32 | | 12 day DMA | 104.94 | | 20 day DMA | 106.51 | | 35 day DMA | 105.7 | | 50 day DMA | 103.5 | | 100 day DMA | 95.3 | | 150 day DMA | 85.88 | | 200 day DMA | 78.21 | EMA (exponential moving average) of Nvent Electric NVT
| EMA period | EMA current | EMA prev | EMA prev2 | | 5 day EMA | 106.35 | 105.36 | 105.55 | | 12 day EMA | 105.93 | 105.49 | 105.58 | | 20 day EMA | 105.78 | 105.51 | 105.57 | | 35 day EMA | 104.44 | 104.21 | 104.17 | | 50 day EMA | 103.28 | 103.07 | 102.99 |
SMA (simple moving average) of Nvent Electric NVT
| SMA period | SMA current | SMA prev | SMA prev2 | | 5 day SMA | 106.32 | 105.96 | 105.95 | | 12 day SMA | 104.94 | 104.59 | 104.72 | | 20 day SMA | 106.51 | 106.72 | 106.95 | | 35 day SMA | 105.7 | 105.49 | 105.33 | | 50 day SMA | 103.5 | 103.31 | 103.19 | | 100 day SMA | 95.3 | 94.96 | 94.66 | | 150 day SMA | 85.88 | 85.52 | 85.19 | | 200 day SMA | 78.21 | 78.01 | 77.82 |
|
|
