NvrInc NVR full analysis,charts,indicators,moving averages,SMA,DMA,EMA,ADX,MACD,RSINvr Inc NVR WideScreen charts, DMA,SMA,EMA technical analysis, forecast prediction, by indicators ADX,MACD,RSI,CCI NYSE stock exchange
operates under Capital Goods sector & deals in Homebuilding
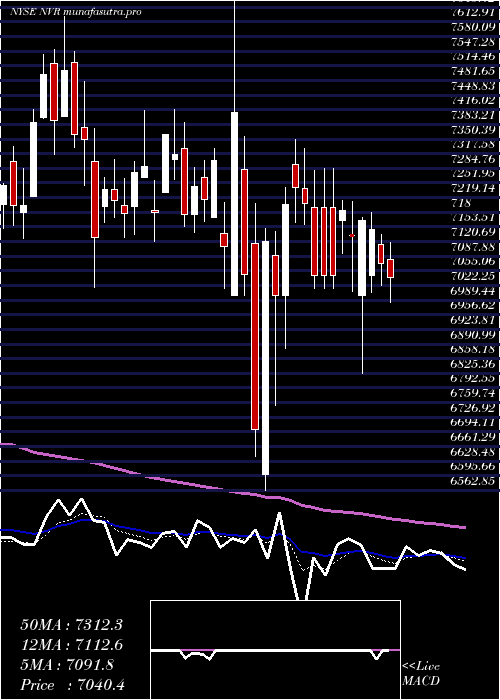
Daily price and charts and targets NvrInc Strong Daily Stock price targets for NvrInc NVR are 7505.75 and 7611.01 | Daily Target 1 | 7424.8 | | Daily Target 2 | 7481.44 | | Daily Target 3 | 7530.06 | | Daily Target 4 | 7586.7 | | Daily Target 5 | 7635.32 |
Daily price and volume Nvr Inc
| Date |
Closing |
Open |
Range |
Volume |
Fri 05 December 2025 |
7538.08 (0.24%) |
7473.42 |
7473.42 - 7578.68 |
0.856 times |
Thu 04 December 2025 |
7519.67 (-2.08%) |
7644.95 |
7483.62 - 7666.16 |
1.0456 times |
Wed 03 December 2025 |
7679.42 (1.03%) |
7648.01 |
7628.04 - 7746.79 |
1.184 times |
Tue 02 December 2025 |
7601.10 (1.12%) |
7563.28 |
7517.09 - 7655.00 |
1.1789 times |
Mon 01 December 2025 |
7517.09 (0.13%) |
7450.00 |
7450.00 - 7614.53 |
0.8867 times |
Fri 28 November 2025 |
7507.29 (-0.78%) |
7607.46 |
7487.68 - 7607.46 |
0.3332 times |
Wed 26 November 2025 |
7566.67 (1.52%) |
7435.94 |
7435.94 - 7593.80 |
0.7688 times |
Tue 25 November 2025 |
7453.38 (2.61%) |
7340.00 |
7335.22 - 7478.50 |
0.9636 times |
Mon 24 November 2025 |
7263.52 (-1.7%) |
7224.30 |
7224.30 - 7354.98 |
1.8555 times |
Fri 21 November 2025 |
7388.82 (3.15%) |
7230.76 |
7230.76 - 7461.22 |
0.9277 times |
Thu 20 November 2025 |
7163.33 (0.61%) |
7189.81 |
7082.07 - 7203.69 |
0.8713 times |
Weekly price and charts NvrInc Strong weekly Stock price targets for NvrInc NVR are 7494.04 and 7790.83 | Weekly Target 1 | 7281.5 | | Weekly Target 2 | 7409.79 | | Weekly Target 3 | 7578.29 | | Weekly Target 4 | 7706.58 | | Weekly Target 5 | 7875.08 |
Weekly price and volumes for Nvr Inc
| Date |
Closing |
Open |
Range |
Volume |
Fri 05 December 2025 |
7538.08 (0.41%) |
7450.00 |
7450.00 - 7746.79 |
1.1673 times |
Fri 28 November 2025 |
7507.29 (1.6%) |
7224.30 |
7224.30 - 7607.46 |
0.8886 times |
Fri 21 November 2025 |
7388.82 (1.61%) |
7259.17 |
7030.00 - 7461.22 |
1.0163 times |
Fri 14 November 2025 |
7271.89 (0.28%) |
7232.59 |
7213.18 - 7378.98 |
1.5809 times |
Fri 07 November 2025 |
7251.24 (0.56%) |
7070.00 |
7003.47 - 7258.67 |
0.7759 times |
Fri 31 October 2025 |
7210.82 (0%) |
7178.96 |
7178.96 - 7267.07 |
0.1649 times |
Fri 31 October 2025 |
7210.82 (-2.96%) |
7460.00 |
7178.96 - 7500.00 |
1.1406 times |
Fri 24 October 2025 |
7430.92 (-2.72%) |
7673.25 |
7425.44 - 7827.92 |
1.1627 times |
Fri 17 October 2025 |
7639.06 (-2.56%) |
7443.91 |
7443.91 - 7780.00 |
1.7319 times |
Tue 07 October 2025 |
7840.11 (-4.13%) |
8199.00 |
7814.94 - 8199.00 |
0.3709 times |
Fri 03 October 2025 |
8178.00 (1.81%) |
8100.00 |
7973.00 - 8188.57 |
0.8606 times |
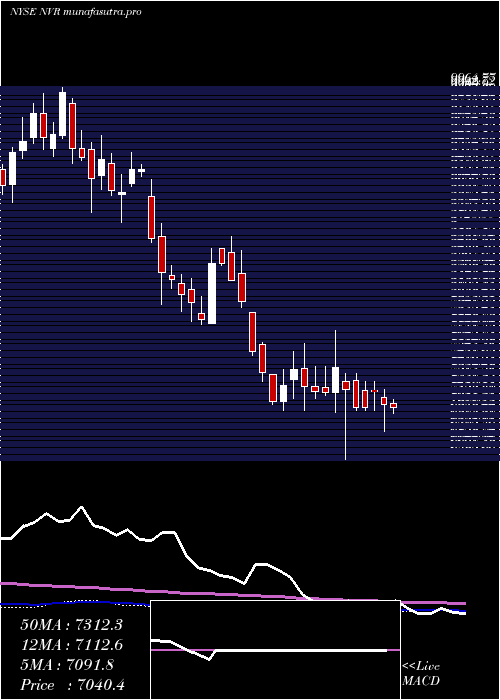
Monthly price and charts NvrInc Strong monthly Stock price targets for NvrInc NVR are 7494.04 and 7790.83 | Monthly Target 1 | 7281.5 | | Monthly Target 2 | 7409.79 | | Monthly Target 3 | 7578.29 | | Monthly Target 4 | 7706.58 | | Monthly Target 5 | 7875.08 |
Monthly price and volumes Nvr Inc
| Date |
Closing |
Open |
Range |
Volume |
Fri 05 December 2025 |
7538.08 (0.41%) |
7450.00 |
7450.00 - 7746.79 |
0.2601 times |
Fri 28 November 2025 |
7507.29 (4.11%) |
7070.00 |
7003.47 - 7607.46 |
0.9497 times |
Fri 31 October 2025 |
7210.82 (-10.25%) |
8066.56 |
7178.96 - 8199.00 |
1.1208 times |
Tue 30 September 2025 |
8034.66 (-1.02%) |
8027.53 |
7900.34 - 8618.28 |
1.0304 times |
Fri 29 August 2025 |
8117.65 (7.53%) |
7619.21 |
7605.00 - 8341.41 |
0.8684 times |
Thu 31 July 2025 |
7549.49 (2.22%) |
7369.91 |
7274.19 - 8042.50 |
1.1053 times |
Mon 30 June 2025 |
7385.66 (3.79%) |
7058.68 |
6941.46 - 7495.00 |
1.1211 times |
Fri 30 May 2025 |
7115.93 (-0.14%) |
7102.00 |
6955.16 - 7563.90 |
0.9509 times |
Wed 30 April 2025 |
7125.75 (-1.64%) |
7265.11 |
6562.85 - 7743.80 |
1.1683 times |
Mon 31 March 2025 |
7244.39 (-0.02%) |
7300.00 |
7017.64 - 7626.14 |
1.4248 times |
Fri 28 February 2025 |
7245.58 (-9.61%) |
7915.02 |
7015.00 - 7915.02 |
1.3385 times |

DMA SMA EMA moving averages of Nvr Inc NVR
DMA (daily moving average) of Nvr Inc NVR
| DMA period | DMA value | | 5 day DMA | 7571.07 | | 12 day DMA | 7443.19 | | 20 day DMA | 7366.31 | | 35 day DMA | 7390.55 | | 50 day DMA | 7550.46 | | 100 day DMA | 7773.16 | | 150 day DMA | 7601.29 | | 200 day DMA | 7503.36 | EMA (exponential moving average) of Nvr Inc NVR
| EMA period | EMA current | EMA prev | EMA prev2 | | 5 day EMA | 7546.39 | 7550.54 | 7565.97 | | 12 day EMA | 7476.16 | 7464.91 | 7454.96 | | 20 day EMA | 7445.12 | 7435.34 | 7426.47 | | 35 day EMA | 7512.69 | 7511.19 | 7510.69 | | 50 day EMA | 7598.19 | 7600.64 | 7603.94 |
SMA (simple moving average) of Nvr Inc NVR
| SMA period | SMA current | SMA prev | SMA prev2 | | 5 day SMA | 7571.07 | 7564.91 | 7574.31 | | 12 day SMA | 7443.19 | 7410.61 | 7380.36 | | 20 day SMA | 7366.31 | 7349.16 | 7332.27 | | 35 day SMA | 7390.55 | 7392.48 | 7396.07 | | 50 day SMA | 7550.46 | 7558.21 | 7569.71 | | 100 day SMA | 7773.16 | 7774.1 | 7775.8 | | 150 day SMA | 7601.29 | 7597.97 | 7594.98 | | 200 day SMA | 7503.36 | 7502.17 | 7502.04 |
|
|
