BankN NTB full analysis,charts,indicators,moving averages,SMA,DMA,EMA,ADX,MACD,RSIBank N NTB WideScreen charts, DMA,SMA,EMA technical analysis, forecast prediction, by indicators ADX,MACD,RSI,CCI NYSE stock exchange
operates under Finance sector & deals in Commercial Banks
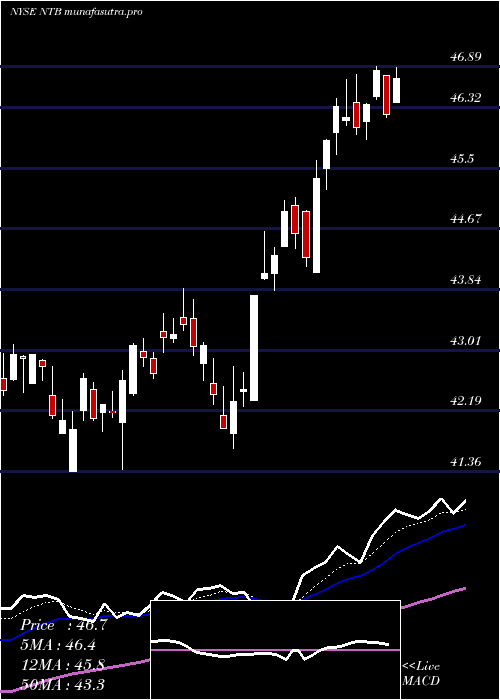
Daily price and charts and targets BankN Strong Daily Stock price targets for BankN NTB are 48.64 and 49.65 | Daily Target 1 | 47.82 | | Daily Target 2 | 48.45 | | Daily Target 3 | 48.833333333333 | | Daily Target 4 | 49.46 | | Daily Target 5 | 49.84 |
Daily price and volume Bank N
| Date |
Closing |
Open |
Range |
Volume |
Fri 05 December 2025 |
49.07 (1.18%) |
48.21 |
48.21 - 49.22 |
1.1224 times |
Thu 04 December 2025 |
48.50 (0.46%) |
48.03 |
47.98 - 48.76 |
0.6527 times |
Wed 03 December 2025 |
48.28 (1.81%) |
47.63 |
47.49 - 48.40 |
1.117 times |
Tue 02 December 2025 |
47.42 (0.36%) |
47.41 |
47.23 - 47.95 |
0.8714 times |
Mon 01 December 2025 |
47.25 (1.74%) |
46.48 |
46.44 - 47.38 |
1.6097 times |
Fri 28 November 2025 |
46.44 (-0.15%) |
46.62 |
46.42 - 46.62 |
0.3861 times |
Wed 26 November 2025 |
46.51 (-0.02%) |
46.24 |
46.24 - 46.76 |
0.8876 times |
Tue 25 November 2025 |
46.52 (1.24%) |
46.14 |
46.14 - 46.58 |
0.8484 times |
Mon 24 November 2025 |
45.95 (-0.58%) |
46.03 |
45.68 - 46.47 |
0.8801 times |
Fri 21 November 2025 |
46.22 (1.99%) |
45.46 |
45.45 - 46.50 |
1.6246 times |
Thu 20 November 2025 |
45.32 (0.62%) |
45.25 |
44.98 - 45.71 |
1.3418 times |
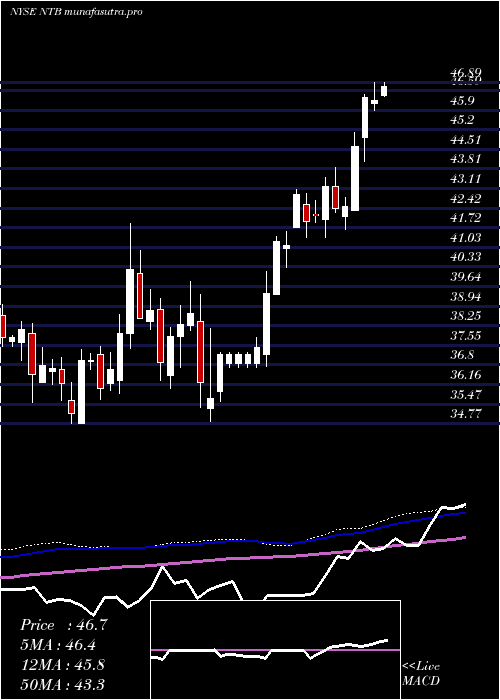
Weekly price and charts BankN Strong weekly Stock price targets for BankN NTB are 47.76 and 50.54 | Weekly Target 1 | 45.46 | | Weekly Target 2 | 47.27 | | Weekly Target 3 | 48.243333333333 | | Weekly Target 4 | 50.05 | | Weekly Target 5 | 51.02 |
Weekly price and volumes for Bank N
| Date |
Closing |
Open |
Range |
Volume |
Fri 05 December 2025 |
49.07 (5.66%) |
46.48 |
46.44 - 49.22 |
0.9547 times |
Fri 28 November 2025 |
46.44 (0.48%) |
46.03 |
45.68 - 46.76 |
0.5334 times |
Fri 21 November 2025 |
46.22 (1.69%) |
45.45 |
44.36 - 46.50 |
0.9922 times |
Fri 14 November 2025 |
45.45 (-0.59%) |
45.39 |
45.21 - 46.80 |
0.9115 times |
Fri 07 November 2025 |
45.72 (-1.17%) |
46.57 |
45.42 - 46.89 |
0.8991 times |
Fri 31 October 2025 |
46.26 (0%) |
45.41 |
45.22 - 46.82 |
0.555 times |
Fri 31 October 2025 |
46.26 (9%) |
42.47 |
41.71 - 46.82 |
1.9872 times |
Fri 24 October 2025 |
42.44 (2.31%) |
41.60 |
41.60 - 42.45 |
1.4658 times |
Fri 17 October 2025 |
41.48 (-1.43%) |
41.65 |
40.59 - 42.60 |
1.1925 times |
Tue 07 October 2025 |
42.08 (-0.45%) |
42.39 |
41.42 - 42.91 |
0.5086 times |
Fri 03 October 2025 |
42.27 (-4.28%) |
43.69 |
41.95 - 43.94 |
0.9782 times |
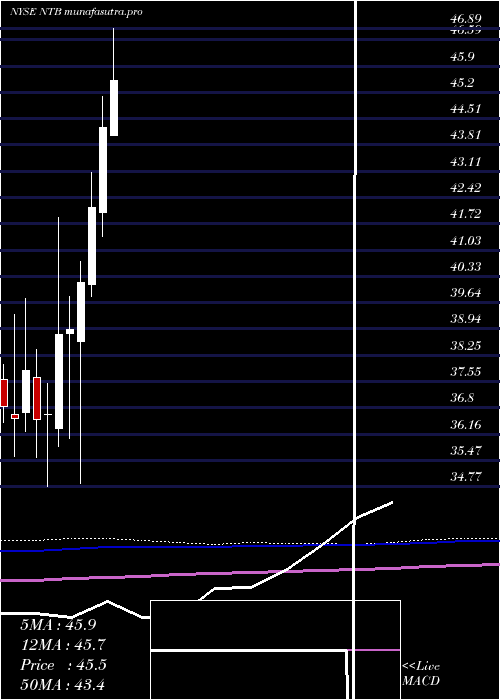
Monthly price and charts BankN Strong monthly Stock price targets for BankN NTB are 47.76 and 50.54 | Monthly Target 1 | 45.46 | | Monthly Target 2 | 47.27 | | Monthly Target 3 | 48.243333333333 | | Monthly Target 4 | 50.05 | | Monthly Target 5 | 51.02 |
Monthly price and volumes Bank N
| Date |
Closing |
Open |
Range |
Volume |
Fri 05 December 2025 |
49.07 (5.66%) |
46.48 |
46.44 - 49.22 |
0.2311 times |
Fri 28 November 2025 |
46.44 (0.39%) |
46.57 |
44.36 - 46.89 |
0.8077 times |
Fri 31 October 2025 |
46.26 (7.78%) |
42.66 |
40.59 - 46.82 |
1.5295 times |
Tue 30 September 2025 |
42.92 (-4.88%) |
43.13 |
42.36 - 46.00 |
1.049 times |
Fri 29 August 2025 |
45.12 (-0.86%) |
44.98 |
43.61 - 46.12 |
1.2117 times |
Thu 31 July 2025 |
45.51 (2.78%) |
44.07 |
44.05 - 46.89 |
1.0147 times |
Mon 30 June 2025 |
44.28 (5.03%) |
42.03 |
41.38 - 45.10 |
0.9237 times |
Fri 30 May 2025 |
42.16 (4.93%) |
40.11 |
39.80 - 43.09 |
0.9928 times |
Wed 30 April 2025 |
40.18 (3.24%) |
38.62 |
34.86 - 40.73 |
1.1111 times |
Mon 31 March 2025 |
38.92 (0.31%) |
38.83 |
36.04 - 39.81 |
1.1287 times |
Fri 28 February 2025 |
38.80 (5.75%) |
36.30 |
35.84 - 41.88 |
1.0619 times |
DMA SMA EMA moving averages of Bank N NTB
DMA (daily moving average) of Bank N NTB
| DMA period | DMA value | | 5 day DMA | 48.1 | | 12 day DMA | 46.88 | | 20 day DMA | 46.37 | | 35 day DMA | 45.26 | | 50 day DMA | 44.5 | | 100 day DMA | 44.77 | | 150 day DMA | 44.2 | | 200 day DMA | 42.64 | EMA (exponential moving average) of Bank N NTB
| EMA period | EMA current | EMA prev | EMA prev2 | | 5 day EMA | 48.17 | 47.72 | 47.33 | | 12 day EMA | 47.23 | 46.89 | 46.6 | | 20 day EMA | 46.58 | 46.32 | 46.09 | | 35 day EMA | 45.66 | 45.46 | 45.28 | | 50 day EMA | 44.89 | 44.72 | 44.57 |
SMA (simple moving average) of Bank N NTB
| SMA period | SMA current | SMA prev | SMA prev2 | | 5 day SMA | 48.1 | 47.58 | 47.18 | | 12 day SMA | 46.88 | 46.53 | 46.22 | | 20 day SMA | 46.37 | 46.21 | 46.12 | | 35 day SMA | 45.26 | 45.03 | 44.84 | | 50 day SMA | 44.5 | 44.41 | 44.34 | | 100 day SMA | 44.77 | 44.75 | 44.73 | | 150 day SMA | 44.2 | 44.14 | 44.08 | | 200 day SMA | 42.64 | 42.59 | 42.55 |
|
|
