NaturalResource NRP full analysis,charts,indicators,moving averages,SMA,DMA,EMA,ADX,MACD,RSINatural Resource NRP WideScreen charts, DMA,SMA,EMA technical analysis, forecast prediction, by indicators ADX,MACD,RSI,CCI NYSE stock exchange
operates under Energy sector & deals in Coal Mining
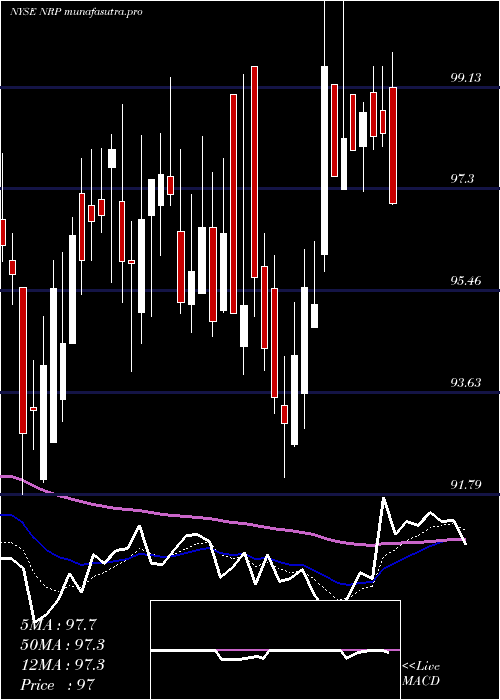
Daily price and charts and targets NaturalResource Strong Daily Stock price targets for NaturalResource NRP are 104.26 and 107.5 | Daily Target 1 | 101.68 | | Daily Target 2 | 103.59 | | Daily Target 3 | 104.92 | | Daily Target 4 | 106.83 | | Daily Target 5 | 108.16 |
Daily price and volume Natural Resource
| Date |
Closing |
Open |
Range |
Volume |
Mon 20 October 2025 |
105.50 (1.6%) |
103.05 |
103.01 - 106.25 |
1.2372 times |
Fri 17 October 2025 |
103.84 (-0.93%) |
104.00 |
102.59 - 104.70 |
1.2726 times |
Thu 16 October 2025 |
104.82 (-1.07%) |
106.20 |
104.00 - 106.20 |
0.7171 times |
Wed 15 October 2025 |
105.95 (-1.05%) |
107.00 |
105.34 - 107.70 |
0.5605 times |
Tue 14 October 2025 |
107.07 (0.9%) |
106.00 |
106.00 - 108.10 |
2.3987 times |
Mon 13 October 2025 |
106.12 (-1.15%) |
106.54 |
105.50 - 108.71 |
0.7827 times |
Tue 07 October 2025 |
107.36 (0.34%) |
106.69 |
106.00 - 108.50 |
0.5302 times |
Mon 06 October 2025 |
107.00 (-0.94%) |
108.87 |
105.55 - 109.20 |
1.0658 times |
Fri 03 October 2025 |
108.02 (0.92%) |
106.74 |
106.50 - 109.76 |
1.2473 times |
Thu 02 October 2025 |
107.03 (0.88%) |
106.00 |
106.00 - 107.94 |
0.1879 times |
Wed 01 October 2025 |
106.10 (1.05%) |
104.37 |
102.68 - 106.89 |
1.7422 times |
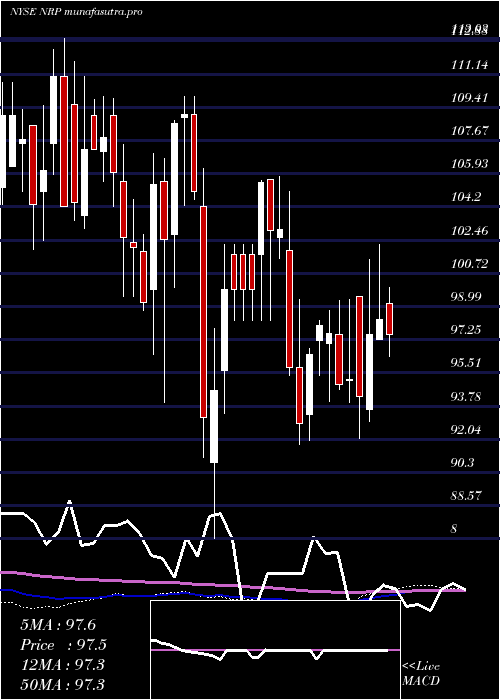
Weekly price and charts NaturalResource Strong weekly Stock price targets for NaturalResource NRP are 104.26 and 107.5 | Weekly Target 1 | 101.68 | | Weekly Target 2 | 103.59 | | Weekly Target 3 | 104.92 | | Weekly Target 4 | 106.83 | | Weekly Target 5 | 108.16 |
Weekly price and volumes for Natural Resource
| Date |
Closing |
Open |
Range |
Volume |
Mon 20 October 2025 |
105.50 (1.6%) |
103.05 |
103.01 - 106.25 |
0.3318 times |
Fri 17 October 2025 |
103.84 (-3.28%) |
106.54 |
102.59 - 108.71 |
1.5373 times |
Tue 07 October 2025 |
107.36 (-0.61%) |
108.87 |
105.55 - 109.20 |
0.4281 times |
Fri 03 October 2025 |
108.02 (3.82%) |
104.87 |
102.57 - 109.76 |
1.8138 times |
Fri 26 September 2025 |
104.05 (2.21%) |
101.20 |
100.58 - 104.17 |
1.7675 times |
Fri 19 September 2025 |
101.80 (-0.04%) |
102.87 |
100.94 - 104.75 |
1.7106 times |
Fri 12 September 2025 |
101.84 (-0.6%) |
102.14 |
99.14 - 104.00 |
0.9318 times |
Fri 05 September 2025 |
102.45 (-1.07%) |
103.50 |
102.45 - 104.99 |
0.6366 times |
Fri 29 August 2025 |
103.56 (0%) |
104.48 |
102.75 - 104.48 |
0.1869 times |
Fri 29 August 2025 |
103.56 (-0.04%) |
103.50 |
101.94 - 105.95 |
0.6555 times |
Fri 22 August 2025 |
103.60 (0.22%) |
103.83 |
101.17 - 105.15 |
0.5865 times |
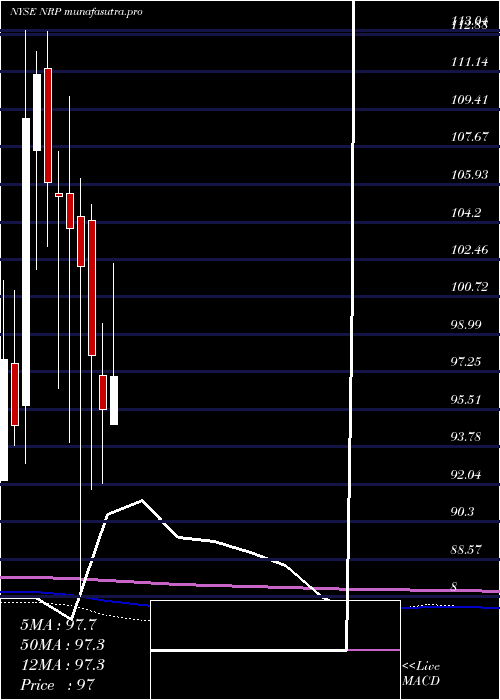
Monthly price and charts NaturalResource Strong monthly Stock price targets for NaturalResource NRP are 104.05 and 111.22 | Monthly Target 1 | 98.78 | | Monthly Target 2 | 102.14 | | Monthly Target 3 | 105.95 | | Monthly Target 4 | 109.31 | | Monthly Target 5 | 113.12 |
Monthly price and volumes Natural Resource
| Date |
Closing |
Open |
Range |
Volume |
Mon 20 October 2025 |
105.50 (0.48%) |
104.37 |
102.59 - 109.76 |
0.4986 times |
Tue 30 September 2025 |
105.00 (1.39%) |
103.50 |
99.14 - 105.00 |
0.9513 times |
Fri 29 August 2025 |
103.56 (1.11%) |
102.99 |
100.00 - 106.00 |
0.5689 times |
Thu 31 July 2025 |
102.42 (7.23%) |
94.80 |
94.80 - 106.99 |
1.2466 times |
Mon 30 June 2025 |
95.51 (-2.54%) |
97.06 |
92.10 - 99.50 |
1.0874 times |
Fri 30 May 2025 |
98.00 (-4.03%) |
104.25 |
91.79 - 104.99 |
0.9139 times |
Wed 30 April 2025 |
102.11 (-1.72%) |
104.43 |
86.83 - 106.23 |
1.1628 times |
Mon 31 March 2025 |
103.90 (-1.4%) |
105.51 |
93.99 - 110.00 |
0.9911 times |
Fri 28 February 2025 |
105.37 (-0.59%) |
105.50 |
96.50 - 107.44 |
0.9547 times |
Fri 31 January 2025 |
106.00 (-4.5%) |
111.30 |
103.08 - 113.03 |
1.6246 times |
Tue 31 December 2024 |
111.00 (1.83%) |
107.52 |
102.00 - 112.10 |
1.1353 times |
DMA SMA EMA moving averages of Natural Resource NRP
DMA (daily moving average) of Natural Resource NRP
| DMA period | DMA value | | 5 day DMA | 105.44 | | 12 day DMA | 106.15 | | 20 day DMA | 104.78 | | 35 day DMA | 103.96 | | 50 day DMA | 103.75 | | 100 day DMA | 100.81 | | 150 day DMA | 100.64 | | 200 day DMA | 101.57 | EMA (exponential moving average) of Natural Resource NRP
| EMA period | EMA current | EMA prev | EMA prev2 | | 5 day EMA | 105.32 | 105.23 | 105.93 | | 12 day EMA | 105.4 | 105.38 | 105.66 | | 20 day EMA | 105.01 | 104.96 | 105.08 | | 35 day EMA | 104.49 | 104.43 | 104.47 | | 50 day EMA | 103.86 | 103.79 | 103.79 |
SMA (simple moving average) of Natural Resource NRP
| SMA period | SMA current | SMA prev | SMA prev2 | | 5 day SMA | 105.44 | 105.56 | 106.26 | | 12 day SMA | 106.15 | 105.99 | 106 | | 20 day SMA | 104.78 | 104.62 | 104.58 | | 35 day SMA | 103.96 | 103.91 | 103.89 | | 50 day SMA | 103.75 | 103.72 | 103.7 | | 100 day SMA | 100.81 | 100.71 | 100.62 | | 150 day SMA | 100.64 | 100.63 | 100.64 | | 200 day SMA | 101.57 | 101.59 | 101.6 |
|
|
