ServicenowInc NOW full analysis,charts,indicators,moving averages,SMA,DMA,EMA,ADX,MACD,RSIServicenow Inc NOW WideScreen charts, DMA,SMA,EMA technical analysis, forecast prediction, by indicators ADX,MACD,RSI,CCI NYSE stock exchange
operates under Technology sector & deals in Computer Software Prepackaged Software
Daily price and charts and targets ServicenowInc Strong Daily Stock price targets for ServicenowInc NOW are 911.95 and 927.62 | Daily Target 1 | 899.64 | | Daily Target 2 | 908.59 | | Daily Target 3 | 915.30666666667 | | Daily Target 4 | 924.26 | | Daily Target 5 | 930.98 |
Daily price and volume Servicenow Inc
| Date |
Closing |
Open |
Range |
Volume |
Mon 20 October 2025 |
917.55 (1.54%) |
906.64 |
906.35 - 922.02 |
1.1754 times |
Fri 17 October 2025 |
903.60 (1.02%) |
890.00 |
887.95 - 906.53 |
0.9213 times |
Thu 16 October 2025 |
894.49 (-0.95%) |
913.97 |
888.07 - 929.00 |
1.1825 times |
Wed 15 October 2025 |
903.05 (-0.9%) |
918.00 |
899.70 - 922.10 |
0.8373 times |
Tue 14 October 2025 |
911.26 (-1.35%) |
907.35 |
897.37 - 924.27 |
0.9643 times |
Mon 13 October 2025 |
923.70 (2.15%) |
897.04 |
892.66 - 925.76 |
1.3 times |
Tue 07 October 2025 |
904.24 (-0.78%) |
914.00 |
893.36 - 915.80 |
1.3104 times |
Mon 06 October 2025 |
911.38 (-0.04%) |
911.90 |
895.54 - 929.76 |
0.6917 times |
Fri 03 October 2025 |
911.74 (0.18%) |
912.54 |
908.33 - 919.70 |
0.7509 times |
Thu 02 October 2025 |
910.10 (-0.26%) |
915.00 |
895.54 - 915.05 |
0.8662 times |
Wed 01 October 2025 |
912.43 (-0.85%) |
920.94 |
892.25 - 935.00 |
2.0068 times |
Weekly price and charts ServicenowInc Strong weekly Stock price targets for ServicenowInc NOW are 911.95 and 927.62 | Weekly Target 1 | 899.64 | | Weekly Target 2 | 908.59 | | Weekly Target 3 | 915.30666666667 | | Weekly Target 4 | 924.26 | | Weekly Target 5 | 930.98 |
Weekly price and volumes for Servicenow Inc
| Date |
Closing |
Open |
Range |
Volume |
Mon 20 October 2025 |
917.55 (1.54%) |
906.64 |
906.35 - 922.02 |
0.206 times |
Fri 17 October 2025 |
903.60 (-0.07%) |
897.04 |
887.95 - 929.00 |
0.9123 times |
Tue 07 October 2025 |
904.24 (-0.82%) |
911.90 |
893.36 - 929.76 |
0.3509 times |
Fri 03 October 2025 |
911.74 (-2.59%) |
942.06 |
892.25 - 954.56 |
1.1038 times |
Fri 26 September 2025 |
936.00 (-2.62%) |
953.89 |
910.46 - 973.63 |
1.2911 times |
Fri 19 September 2025 |
961.15 (3.47%) |
930.45 |
928.47 - 965.74 |
1.6201 times |
Fri 12 September 2025 |
928.96 (1.66%) |
915.14 |
912.56 - 945.00 |
1.2237 times |
Fri 05 September 2025 |
913.80 (-0.4%) |
901.77 |
878.19 - 921.34 |
1.0712 times |
Fri 29 August 2025 |
917.46 (0%) |
929.26 |
909.71 - 933.99 |
0.3617 times |
Fri 29 August 2025 |
917.46 (3.46%) |
889.71 |
855.08 - 935.78 |
1.8591 times |
Fri 22 August 2025 |
886.75 (2.25%) |
866.45 |
865.37 - 900.91 |
1.7192 times |

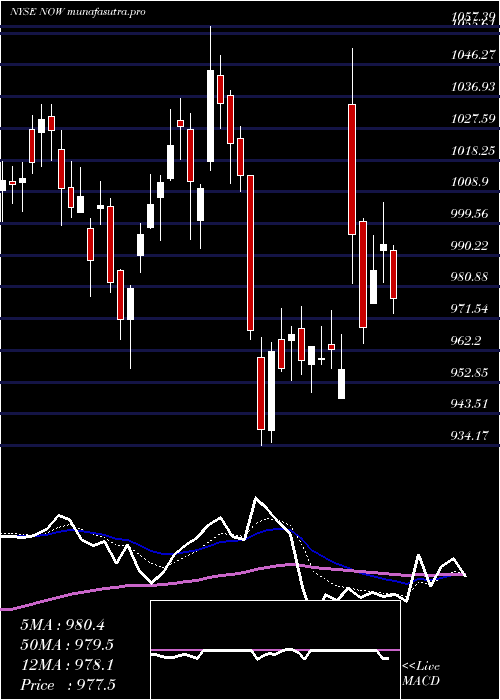
Monthly price and charts ServicenowInc Strong monthly Stock price targets for ServicenowInc NOW are 879.23 and 926.28 | Monthly Target 1 | 866.45 | | Monthly Target 2 | 892 | | Monthly Target 3 | 913.5 | | Monthly Target 4 | 939.05 | | Monthly Target 5 | 960.55 |
Monthly price and volumes Servicenow Inc
| Date |
Closing |
Open |
Range |
Volume |
Mon 20 October 2025 |
917.55 (-0.3%) |
920.94 |
887.95 - 935.00 |
0.3441 times |
Tue 30 September 2025 |
920.28 (0.31%) |
901.77 |
878.19 - 973.63 |
0.9281 times |
Fri 29 August 2025 |
917.46 (-2.72%) |
937.29 |
840.03 - 937.29 |
1.2815 times |
Thu 31 July 2025 |
943.12 (-8.26%) |
1027.26 |
934.17 - 1057.39 |
1.0667 times |
Mon 30 June 2025 |
1028.08 (1.68%) |
1009.14 |
956.83 - 1036.37 |
0.6648 times |
Fri 30 May 2025 |
1011.09 (5.87%) |
973.86 |
957.52 - 1046.00 |
0.9191 times |
Wed 30 April 2025 |
955.01 (19.96%) |
798.22 |
678.66 - 961.03 |
1.3637 times |
Mon 31 March 2025 |
796.14 (-14.37%) |
936.01 |
757.84 - 939.00 |
1.3155 times |
Fri 28 February 2025 |
929.76 (-8.7%) |
1006.50 |
898.21 - 1043.45 |
0.9583 times |
Fri 31 January 2025 |
1018.38 (-3.94%) |
1073.52 |
990.00 - 1198.09 |
1.158 times |
Tue 31 December 2024 |
1060.12 (-0.93%) |
1124.20 |
1052.93 - 1157.90 |
0.5674 times |

DMA SMA EMA moving averages of Servicenow Inc NOW
DMA (daily moving average) of Servicenow Inc NOW
| DMA period | DMA value | | 5 day DMA | 905.99 | | 12 day DMA | 910.32 | | 20 day DMA | 921.85 | | 35 day DMA | 923.92 | | 50 day DMA | 908.81 | | 100 day DMA | 949.87 | | 150 day DMA | 924.87 | | 200 day DMA | 944.69 | EMA (exponential moving average) of Servicenow Inc NOW
| EMA period | EMA current | EMA prev | EMA prev2 | | 5 day EMA | 908.93 | 904.62 | 905.13 | | 12 day EMA | 912.48 | 911.56 | 913.01 | | 20 day EMA | 915.7 | 915.51 | 916.76 | | 35 day EMA | 913.35 | 913.1 | 913.66 | | 50 day EMA | 910.33 | 910.04 | 910.3 |
SMA (simple moving average) of Servicenow Inc NOW
| SMA period | SMA current | SMA prev | SMA prev2 | | 5 day SMA | 905.99 | 907.22 | 907.35 | | 12 day SMA | 910.32 | 912.26 | 914.96 | | 20 day SMA | 921.85 | 923.49 | 924.91 | | 35 day SMA | 923.92 | 923.08 | 921.96 | | 50 day SMA | 908.81 | 908.71 | 908.74 | | 100 day SMA | 949.87 | 950.84 | 952.02 | | 150 day SMA | 924.87 | 924.37 | 923.74 | | 200 day SMA | 944.69 | 945.44 | 946.33 |
|
|
