NuveenMissouri NOM full analysis,charts,indicators,moving averages,SMA,DMA,EMA,ADX,MACD,RSINuveen Missouri NOM WideScreen charts, DMA,SMA,EMA technical analysis, forecast prediction, by indicators ADX,MACD,RSI,CCI NYSE stock exchange
operates under N A sector & deals in N A
Daily price and charts and targets NuveenMissouri Strong Daily Stock price targets for NuveenMissouri NOM are 10.57 and 11.08 | Daily Target 1 | 10.48 | | Daily Target 2 | 10.65 | | Daily Target 3 | 10.986666666667 | | Daily Target 4 | 11.16 | | Daily Target 5 | 11.5 |
Daily price and volume Nuveen Missouri
| Date |
Closing |
Open |
Range |
Volume |
Mon 20 October 2025 |
10.83 (0.28%) |
11.00 |
10.81 - 11.32 |
0.5469 times |
Fri 17 October 2025 |
10.80 (-0.74%) |
11.01 |
10.80 - 11.05 |
0.4922 times |
Thu 16 October 2025 |
10.88 (0.18%) |
11.00 |
10.88 - 11.07 |
0.7657 times |
Wed 15 October 2025 |
10.86 (-0.28%) |
11.09 |
10.75 - 11.22 |
1.5314 times |
Tue 14 October 2025 |
10.89 (-0.37%) |
11.05 |
10.89 - 11.05 |
0.5105 times |
Mon 13 October 2025 |
10.93 (-0.64%) |
11.17 |
10.70 - 11.18 |
2.5524 times |
Tue 07 October 2025 |
11.00 (-0.36%) |
10.95 |
10.95 - 11.04 |
0.9845 times |
Mon 06 October 2025 |
11.04 (0.55%) |
11.04 |
11.04 - 11.04 |
0.0638 times |
Fri 03 October 2025 |
10.98 (-0.63%) |
11.05 |
10.90 - 11.05 |
1.8596 times |
Thu 02 October 2025 |
11.05 (0.64%) |
11.05 |
11.00 - 11.05 |
0.693 times |
Wed 01 October 2025 |
10.98 (-0.18%) |
11.11 |
10.90 - 11.19 |
1.6408 times |
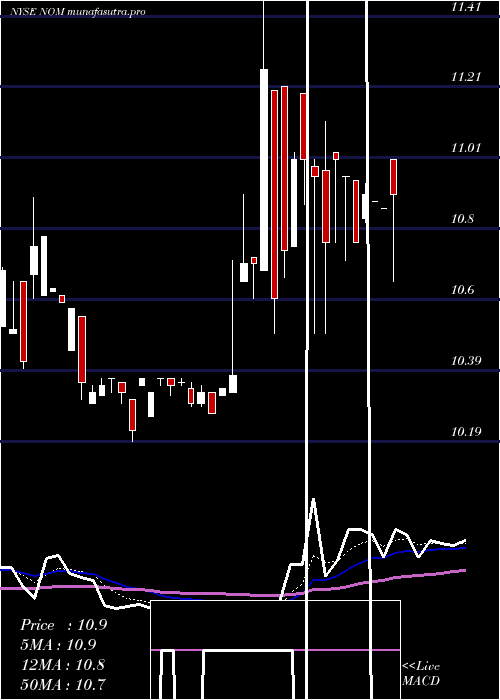
Weekly price and charts NuveenMissouri Strong weekly Stock price targets for NuveenMissouri NOM are 10.57 and 11.08 | Weekly Target 1 | 10.48 | | Weekly Target 2 | 10.65 | | Weekly Target 3 | 10.986666666667 | | Weekly Target 4 | 11.16 | | Weekly Target 5 | 11.5 |
Weekly price and volumes for Nuveen Missouri
| Date |
Closing |
Open |
Range |
Volume |
Mon 20 October 2025 |
10.83 (0.28%) |
11.00 |
10.81 - 11.32 |
0.1088 times |
Fri 17 October 2025 |
10.80 (-1.82%) |
11.17 |
10.70 - 11.22 |
1.1637 times |
Tue 07 October 2025 |
11.00 (0.18%) |
11.04 |
10.95 - 11.04 |
0.2084 times |
Fri 03 October 2025 |
10.98 (0.18%) |
10.98 |
10.90 - 11.19 |
0.9063 times |
Fri 26 September 2025 |
10.96 (-1.79%) |
11.10 |
10.86 - 11.32 |
1.6929 times |
Fri 19 September 2025 |
11.16 (-0.62%) |
11.28 |
10.88 - 11.32 |
0.9969 times |
Fri 12 September 2025 |
11.23 (2.93%) |
10.96 |
10.84 - 11.26 |
2.6174 times |
Fri 05 September 2025 |
10.91 (-0.64%) |
11.08 |
10.80 - 11.14 |
0.5111 times |
Fri 29 August 2025 |
10.98 (0%) |
10.89 |
10.86 - 11.09 |
0.1849 times |
Fri 29 August 2025 |
10.98 (-0.09%) |
10.99 |
10.85 - 11.12 |
1.6096 times |
Fri 22 August 2025 |
10.99 (0.37%) |
10.97 |
10.63 - 11.07 |
0.5873 times |

Monthly price and charts NuveenMissouri Strong monthly Stock price targets for NuveenMissouri NOM are 10.46 and 11.08 | Monthly Target 1 | 10.33 | | Monthly Target 2 | 10.58 | | Monthly Target 3 | 10.95 | | Monthly Target 4 | 11.2 | | Monthly Target 5 | 11.57 |
Monthly price and volumes Nuveen Missouri
| Date |
Closing |
Open |
Range |
Volume |
Mon 20 October 2025 |
10.83 (-1.55%) |
11.11 |
10.70 - 11.32 |
0.5949 times |
Tue 30 September 2025 |
11.00 (0.18%) |
11.08 |
10.80 - 11.32 |
1.514 times |
Fri 29 August 2025 |
10.98 (1.1%) |
11.00 |
10.50 - 11.12 |
1.0174 times |
Thu 31 July 2025 |
10.86 (4.73%) |
10.37 |
10.27 - 11.47 |
1.5633 times |
Mon 30 June 2025 |
10.37 (-2.9%) |
10.50 |
10.19 - 10.89 |
0.5811 times |
Fri 30 May 2025 |
10.68 (4.71%) |
10.29 |
10.13 - 11.00 |
0.6769 times |
Wed 30 April 2025 |
10.20 (-1.45%) |
10.44 |
9.63 - 10.52 |
1.0919 times |
Mon 31 March 2025 |
10.35 (-4.61%) |
10.99 |
10.24 - 11.16 |
1.006 times |
Fri 28 February 2025 |
10.85 (-4.24%) |
11.69 |
10.80 - 11.90 |
1.2298 times |
Fri 31 January 2025 |
11.33 (-5.5%) |
11.49 |
11.10 - 12.25 |
0.7247 times |
Tue 31 December 2024 |
11.99 (13.43%) |
11.12 |
10.58 - 11.99 |
1.344 times |

DMA SMA EMA moving averages of Nuveen Missouri NOM
DMA (daily moving average) of Nuveen Missouri NOM
| DMA period | DMA value | | 5 day DMA | 10.85 | | 12 day DMA | 10.94 | | 20 day DMA | 11 | | 35 day DMA | 11.03 | | 50 day DMA | 10.99 | | 100 day DMA | 10.81 | | 150 day DMA | 10.63 | | 200 day DMA | 10.83 | EMA (exponential moving average) of Nuveen Missouri NOM
| EMA period | EMA current | EMA prev | EMA prev2 | | 5 day EMA | 10.86 | 10.87 | 10.91 | | 12 day EMA | 10.92 | 10.94 | 10.96 | | 20 day EMA | 10.97 | 10.98 | 11 | | 35 day EMA | 10.96 | 10.97 | 10.98 | | 50 day EMA | 10.96 | 10.97 | 10.98 |
SMA (simple moving average) of Nuveen Missouri NOM
| SMA period | SMA current | SMA prev | SMA prev2 | | 5 day SMA | 10.85 | 10.87 | 10.91 | | 12 day SMA | 10.94 | 10.95 | 10.97 | | 20 day SMA | 11 | 11.02 | 11.04 | | 35 day SMA | 11.03 | 11.03 | 11.04 | | 50 day SMA | 10.99 | 10.99 | 10.99 | | 100 day SMA | 10.81 | 10.8 | 10.8 | | 150 day SMA | 10.63 | 10.63 | 10.63 | | 200 day SMA | 10.83 | 10.83 | 10.84 |
|
|
