NorthAmerican NOA full analysis,charts,indicators,moving averages,SMA,DMA,EMA,ADX,MACD,RSINorth American NOA WideScreen charts, DMA,SMA,EMA technical analysis, forecast prediction, by indicators ADX,MACD,RSI,CCI NYSE stock exchange
operates under Energy sector & deals in Oilfield Services Equipment
Daily price and charts and targets NorthAmerican Strong Daily Stock price targets for NorthAmerican NOA are 14.63 and 15.15 | Daily Target 1 | 14.22 | | Daily Target 2 | 14.52 | | Daily Target 3 | 14.736666666667 | | Daily Target 4 | 15.04 | | Daily Target 5 | 15.26 |
Daily price and volume North American
| Date |
Closing |
Open |
Range |
Volume |
Mon 20 October 2025 |
14.83 (3.13%) |
14.43 |
14.43 - 14.95 |
0.8201 times |
Fri 17 October 2025 |
14.38 (-0.35%) |
14.48 |
14.05 - 14.50 |
0.8031 times |
Thu 16 October 2025 |
14.43 (-1.37%) |
14.72 |
14.35 - 14.72 |
0.5974 times |
Wed 15 October 2025 |
14.63 (1.53%) |
14.59 |
14.44 - 14.73 |
0.8333 times |
Tue 14 October 2025 |
14.41 (5.8%) |
13.41 |
13.41 - 14.45 |
1.14 times |
Mon 13 October 2025 |
13.62 (-6.65%) |
13.60 |
13.45 - 13.67 |
0.5143 times |
Tue 07 October 2025 |
14.59 (-2.73%) |
14.62 |
14.39 - 15.13 |
2.1271 times |
Mon 06 October 2025 |
15.00 (4.6%) |
14.39 |
14.30 - 15.00 |
1.7823 times |
Fri 03 October 2025 |
14.34 (-1.38%) |
14.56 |
14.29 - 14.60 |
0.7361 times |
Thu 02 October 2025 |
14.54 (-0.48%) |
14.57 |
14.24 - 14.63 |
0.6465 times |
Wed 01 October 2025 |
14.61 (2.89%) |
14.12 |
14.12 - 14.71 |
1.8289 times |
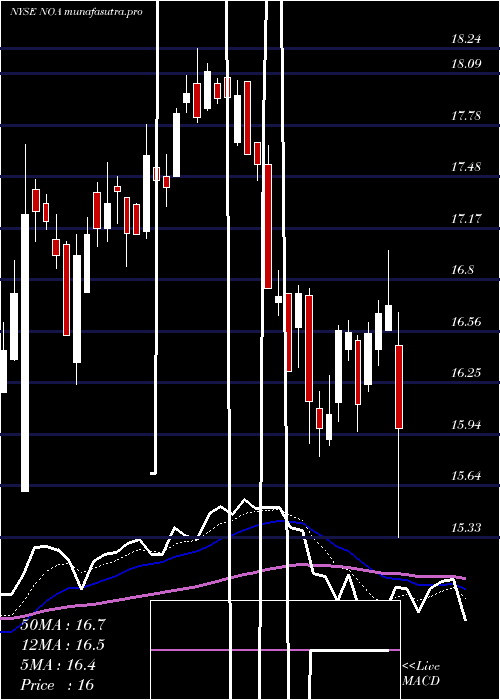
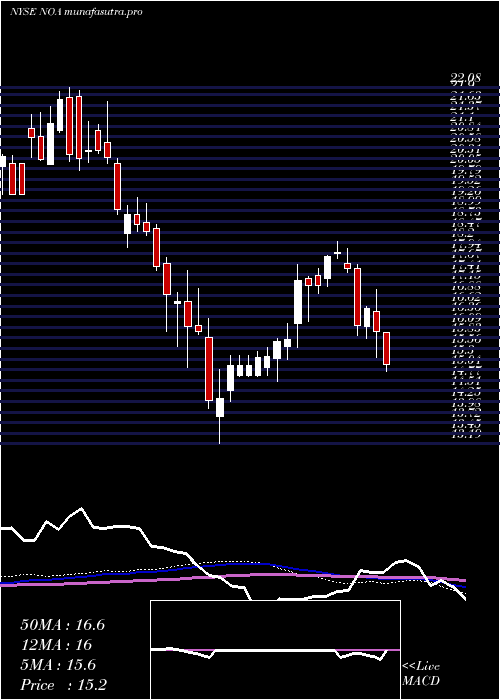
Weekly price and charts NorthAmerican Strong weekly Stock price targets for NorthAmerican NOA are 14.63 and 15.15 | Weekly Target 1 | 14.22 | | Weekly Target 2 | 14.52 | | Weekly Target 3 | 14.736666666667 | | Weekly Target 4 | 15.04 | | Weekly Target 5 | 15.26 |
Weekly price and volumes for North American
| Date |
Closing |
Open |
Range |
Volume |
Mon 20 October 2025 |
14.83 (3.13%) |
14.43 |
14.43 - 14.95 |
0.2267 times |
Fri 17 October 2025 |
14.38 (-1.44%) |
13.60 |
13.41 - 14.73 |
1.0746 times |
Tue 07 October 2025 |
14.59 (1.74%) |
14.39 |
14.30 - 15.13 |
1.0805 times |
Fri 03 October 2025 |
14.34 (3.69%) |
13.80 |
13.66 - 14.71 |
1.3712 times |
Fri 26 September 2025 |
13.83 (2.29%) |
13.40 |
13.37 - 14.07 |
1.2345 times |
Fri 19 September 2025 |
13.52 (-1.1%) |
13.66 |
13.47 - 14.23 |
1.0869 times |
Fri 12 September 2025 |
13.67 (2.24%) |
13.32 |
13.10 - 13.77 |
1.5454 times |
Fri 05 September 2025 |
13.37 (-2.19%) |
13.52 |
13.21 - 13.68 |
1.1904 times |
Fri 29 August 2025 |
13.67 (0%) |
13.57 |
13.46 - 13.71 |
0.2282 times |
Fri 29 August 2025 |
13.67 (0.81%) |
13.49 |
13.05 - 13.71 |
0.9617 times |
Fri 22 August 2025 |
13.56 (10.15%) |
12.29 |
12.12 - 13.76 |
3.7142 times |
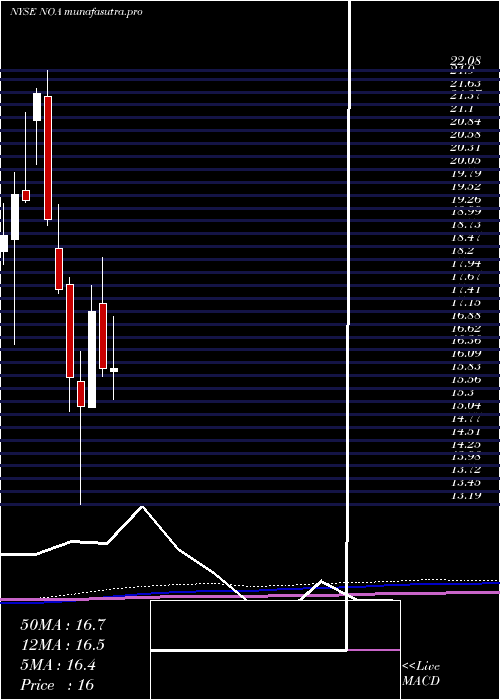
Monthly price and charts NorthAmerican Strong monthly Stock price targets for NorthAmerican NOA are 14.12 and 15.84 | Monthly Target 1 | 12.74 | | Monthly Target 2 | 13.78 | | Monthly Target 3 | 14.456666666667 | | Monthly Target 4 | 15.5 | | Monthly Target 5 | 16.18 |
Monthly price and volumes North American
| Date |
Closing |
Open |
Range |
Volume |
Mon 20 October 2025 |
14.83 (4.44%) |
14.12 |
13.41 - 15.13 |
0.697 times |
Tue 30 September 2025 |
14.20 (3.88%) |
13.52 |
13.10 - 14.26 |
1.1812 times |
Fri 29 August 2025 |
13.67 (-9.05%) |
14.94 |
12.12 - 16.80 |
2.2883 times |
Thu 31 July 2025 |
15.03 (-5.94%) |
15.91 |
14.92 - 17.04 |
0.7231 times |
Mon 30 June 2025 |
15.98 (-6.77%) |
17.31 |
15.81 - 18.24 |
0.6021 times |
Fri 30 May 2025 |
17.14 (12.84%) |
15.17 |
15.17 - 17.67 |
0.897 times |
Wed 30 April 2025 |
15.19 (-3.8%) |
15.72 |
13.19 - 16.32 |
1.2012 times |
Mon 31 March 2025 |
15.79 (-10.28%) |
17.69 |
15.09 - 17.83 |
1.1107 times |
Fri 28 February 2025 |
17.60 (-7.47%) |
18.43 |
17.50 - 19.33 |
0.545 times |
Fri 31 January 2025 |
19.02 (-11.99%) |
21.55 |
18.91 - 22.08 |
0.7544 times |
Tue 31 December 2024 |
21.61 (11.33%) |
21.04 |
20.15 - 21.70 |
0.362 times |
DMA SMA EMA moving averages of North American NOA
DMA (daily moving average) of North American NOA
| DMA period | DMA value | | 5 day DMA | 14.54 | | 12 day DMA | 14.47 | | 20 day DMA | 14.18 | | 35 day DMA | 13.93 | | 50 day DMA | 13.98 | | 100 day DMA | 15.23 | | 150 day DMA | 15.4 | | 200 day DMA | 16.37 | EMA (exponential moving average) of North American NOA
| EMA period | EMA current | EMA prev | EMA prev2 | | 5 day EMA | 14.55 | 14.41 | 14.42 | | 12 day EMA | 14.39 | 14.31 | 14.3 | | 20 day EMA | 14.28 | 14.22 | 14.2 | | 35 day EMA | 14.2 | 14.16 | 14.15 | | 50 day EMA | 14.11 | 14.08 | 14.07 |
SMA (simple moving average) of North American NOA
| SMA period | SMA current | SMA prev | SMA prev2 | | 5 day SMA | 14.54 | 14.29 | 14.34 | | 12 day SMA | 14.47 | 14.41 | 14.36 | | 20 day SMA | 14.18 | 14.13 | 14.11 | | 35 day SMA | 13.93 | 13.89 | 13.86 | | 50 day SMA | 13.98 | 13.99 | 14 | | 100 day SMA | 15.23 | 15.25 | 15.27 | | 150 day SMA | 15.4 | 15.41 | 15.42 | | 200 day SMA | 16.37 | 16.4 | 16.43 |
|
|
