NationalRetail NNN full analysis,charts,indicators,moving averages,SMA,DMA,EMA,ADX,MACD,RSINational Retail NNN WideScreen charts, DMA,SMA,EMA technical analysis, forecast prediction, by indicators ADX,MACD,RSI,CCI NYSE stock exchange
operates under Consumer Services sector & deals in Real Estate Investment Trusts
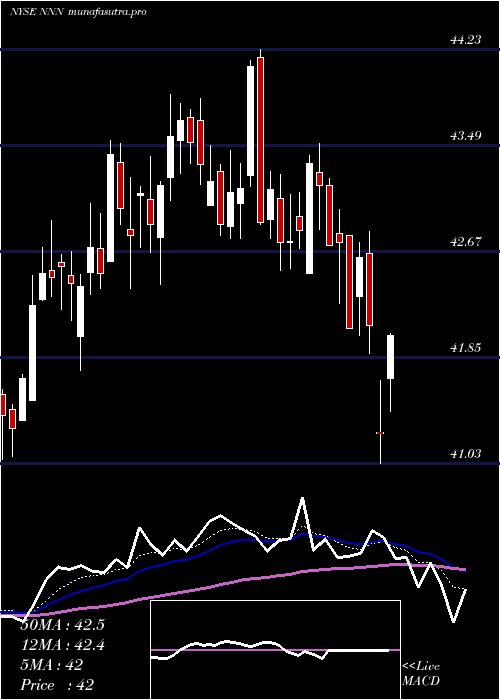
Daily price and charts and targets NationalRetail Strong Daily Stock price targets for NationalRetail NNN are 39.92 and 40.47 | Daily Target 1 | 39.82 | | Daily Target 2 | 40.02 | | Daily Target 3 | 40.373333333333 | | Daily Target 4 | 40.57 | | Daily Target 5 | 40.92 |
Daily price and volume National Retail
| Date |
Closing |
Open |
Range |
Volume |
Fri 05 December 2025 |
40.21 (-1.06%) |
40.61 |
40.18 - 40.73 |
1.1149 times |
Thu 04 December 2025 |
40.64 (-1.14%) |
40.93 |
40.51 - 41.20 |
1.4244 times |
Wed 03 December 2025 |
41.11 (1.23%) |
40.65 |
40.65 - 41.16 |
1.0299 times |
Tue 02 December 2025 |
40.61 (-0.68%) |
41.05 |
40.38 - 41.05 |
0.9545 times |
Mon 01 December 2025 |
40.89 (-1.11%) |
41.06 |
40.87 - 41.16 |
0.8219 times |
Fri 28 November 2025 |
41.35 (0.66%) |
41.08 |
41.05 - 41.39 |
0.3759 times |
Wed 26 November 2025 |
41.08 (0.2%) |
41.01 |
41.01 - 41.36 |
0.7543 times |
Tue 25 November 2025 |
41.00 (0.37%) |
41.10 |
40.99 - 41.28 |
0.7788 times |
Mon 24 November 2025 |
40.85 (-0.24%) |
41.08 |
40.80 - 41.19 |
1.2373 times |
Fri 21 November 2025 |
40.95 (1.36%) |
40.59 |
40.45 - 41.25 |
1.508 times |
Thu 20 November 2025 |
40.40 (-0.54%) |
40.74 |
40.35 - 40.97 |
1.2299 times |
Weekly price and charts NationalRetail Strong weekly Stock price targets for NationalRetail NNN are 39.69 and 40.71 | Weekly Target 1 | 39.51 | | Weekly Target 2 | 39.86 | | Weekly Target 3 | 40.53 | | Weekly Target 4 | 40.88 | | Weekly Target 5 | 41.55 |
Weekly price and volumes for National Retail
| Date |
Closing |
Open |
Range |
Volume |
Fri 05 December 2025 |
40.21 (-2.76%) |
41.06 |
40.18 - 41.20 |
1.255 times |
Fri 28 November 2025 |
41.35 (0.98%) |
41.08 |
40.80 - 41.39 |
0.7387 times |
Fri 21 November 2025 |
40.95 (-0.7%) |
41.37 |
40.35 - 41.49 |
1.3342 times |
Fri 14 November 2025 |
41.24 (1.35%) |
40.57 |
40.18 - 41.47 |
1.119 times |
Fri 07 November 2025 |
40.69 (0.57%) |
41.17 |
39.46 - 41.50 |
1.313 times |
Fri 31 October 2025 |
40.46 (0%) |
40.15 |
39.99 - 40.65 |
0.4015 times |
Fri 31 October 2025 |
40.46 (-4.01%) |
42.08 |
39.99 - 42.23 |
1.4486 times |
Fri 24 October 2025 |
42.15 (-1.43%) |
42.76 |
41.86 - 43.00 |
1.199 times |
Fri 17 October 2025 |
42.76 (1.23%) |
41.50 |
41.50 - 42.85 |
0.926 times |
Tue 07 October 2025 |
42.24 (-1.35%) |
42.80 |
42.12 - 43.19 |
0.265 times |
Fri 03 October 2025 |
42.82 (1.06%) |
42.45 |
41.94 - 43.39 |
0.9343 times |

Monthly price and charts NationalRetail Strong monthly Stock price targets for NationalRetail NNN are 39.69 and 40.71 | Monthly Target 1 | 39.51 | | Monthly Target 2 | 39.86 | | Monthly Target 3 | 40.53 | | Monthly Target 4 | 40.88 | | Monthly Target 5 | 41.55 |
Monthly price and volumes National Retail
| Date |
Closing |
Open |
Range |
Volume |
Fri 05 December 2025 |
40.21 (-2.76%) |
41.06 |
40.18 - 41.20 |
0.275 times |
Fri 28 November 2025 |
41.35 (2.2%) |
41.17 |
39.46 - 41.50 |
0.9873 times |
Fri 31 October 2025 |
40.46 (-4.96%) |
42.68 |
39.99 - 43.39 |
1.035 times |
Tue 30 September 2025 |
42.57 (-0.79%) |
42.76 |
41.70 - 43.35 |
1.1893 times |
Fri 29 August 2025 |
42.91 (4%) |
41.69 |
40.65 - 42.95 |
1.1798 times |
Thu 31 July 2025 |
41.26 (-4.45%) |
43.24 |
41.03 - 44.23 |
1.1041 times |
Mon 30 June 2025 |
43.18 (3.4%) |
41.46 |
41.06 - 43.53 |
0.8189 times |
Fri 30 May 2025 |
41.76 (1.58%) |
41.79 |
40.20 - 42.50 |
0.891 times |
Wed 30 April 2025 |
41.11 (-3.61%) |
42.88 |
35.80 - 42.89 |
1.3851 times |
Mon 31 March 2025 |
42.65 (0.47%) |
42.26 |
41.07 - 44.19 |
1.1346 times |
Fri 28 February 2025 |
42.45 (7.77%) |
39.03 |
38.01 - 42.89 |
1.2128 times |

DMA SMA EMA moving averages of National Retail NNN
DMA (daily moving average) of National Retail NNN
| DMA period | DMA value | | 5 day DMA | 40.69 | | 12 day DMA | 40.81 | | 20 day DMA | 40.88 | | 35 day DMA | 41.08 | | 50 day DMA | 41.48 | | 100 day DMA | 41.92 | | 150 day DMA | 41.99 | | 200 day DMA | 41.87 | EMA (exponential moving average) of National Retail NNN
| EMA period | EMA current | EMA prev | EMA prev2 | | 5 day EMA | 40.64 | 40.85 | 40.96 | | 12 day EMA | 40.79 | 40.89 | 40.94 | | 20 day EMA | 40.89 | 40.96 | 40.99 | | 35 day EMA | 41.21 | 41.27 | 41.31 | | 50 day EMA | 41.45 | 41.5 | 41.54 |
SMA (simple moving average) of National Retail NNN
| SMA period | SMA current | SMA prev | SMA prev2 | | 5 day SMA | 40.69 | 40.92 | 41.01 | | 12 day SMA | 40.81 | 40.89 | 40.92 | | 20 day SMA | 40.88 | 40.86 | 40.82 | | 35 day SMA | 41.08 | 41.14 | 41.2 | | 50 day SMA | 41.48 | 41.51 | 41.54 | | 100 day SMA | 41.92 | 41.95 | 41.97 | | 150 day SMA | 41.99 | 42 | 42 | | 200 day SMA | 41.87 | 41.87 | 41.88 |
|
|
