NelnetInc NNI full analysis,charts,indicators,moving averages,SMA,DMA,EMA,ADX,MACD,RSINelnet Inc NNI WideScreen charts, DMA,SMA,EMA technical analysis, forecast prediction, by indicators ADX,MACD,RSI,CCI NYSE stock exchange
operates under Finance sector & deals in Finance Consumer Services
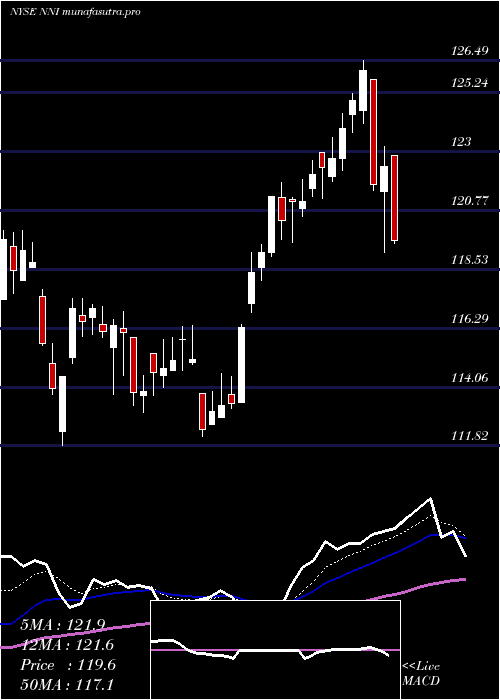
Daily price and charts and targets NelnetInc Strong Daily Stock price targets for NelnetInc NNI are 128.02 and 133.05 | Daily Target 1 | 126.79 | | Daily Target 2 | 129.24 | | Daily Target 3 | 131.81666666667 | | Daily Target 4 | 134.27 | | Daily Target 5 | 136.85 |
Daily price and volume Nelnet Inc
| Date |
Closing |
Open |
Range |
Volume |
Thu 04 December 2025 |
131.70 (-1.11%) |
133.00 |
129.36 - 134.39 |
1.12 times |
Wed 03 December 2025 |
133.18 (1.58%) |
131.44 |
129.76 - 133.46 |
1.3334 times |
Tue 02 December 2025 |
131.11 (0.91%) |
130.21 |
129.03 - 131.59 |
0.6923 times |
Mon 01 December 2025 |
129.93 (0.53%) |
128.28 |
127.95 - 130.08 |
1.1376 times |
Fri 28 November 2025 |
129.24 (-0.88%) |
131.00 |
128.48 - 131.00 |
1.0784 times |
Wed 26 November 2025 |
130.39 (0.45%) |
128.83 |
128.83 - 130.54 |
0.9385 times |
Tue 25 November 2025 |
129.81 (2.7%) |
127.16 |
126.96 - 129.82 |
1.116 times |
Mon 24 November 2025 |
126.40 (-1.07%) |
126.88 |
125.52 - 128.27 |
1.0137 times |
Fri 21 November 2025 |
127.77 (2.43%) |
125.57 |
124.92 - 128.67 |
0.6172 times |
Thu 20 November 2025 |
124.74 (-1.13%) |
126.83 |
124.65 - 127.77 |
0.9529 times |
Wed 19 November 2025 |
126.17 (1.13%) |
124.66 |
124.42 - 126.89 |
1.0784 times |
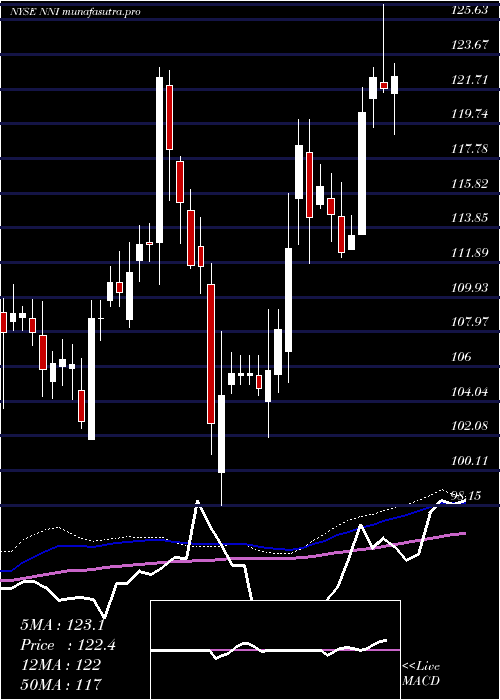
Weekly price and charts NelnetInc Strong weekly Stock price targets for NelnetInc NNI are 129.83 and 136.27 | Weekly Target 1 | 124.91 | | Weekly Target 2 | 128.3 | | Weekly Target 3 | 131.34666666667 | | Weekly Target 4 | 134.74 | | Weekly Target 5 | 137.79 |
Weekly price and volumes for Nelnet Inc
| Date |
Closing |
Open |
Range |
Volume |
Thu 04 December 2025 |
131.70 (1.9%) |
128.28 |
127.95 - 134.39 |
1.3917 times |
Fri 28 November 2025 |
129.24 (1.15%) |
126.88 |
125.52 - 131.00 |
1.3473 times |
Fri 21 November 2025 |
127.77 (-1.11%) |
128.30 |
121.27 - 128.99 |
1.4575 times |
Fri 14 November 2025 |
129.20 (-2.62%) |
132.64 |
127.87 - 133.50 |
1.4242 times |
Fri 07 November 2025 |
132.68 (2.81%) |
128.50 |
127.50 - 136.68 |
1.1515 times |
Fri 31 October 2025 |
129.05 (0%) |
127.52 |
127.25 - 129.61 |
0.2216 times |
Fri 31 October 2025 |
129.05 (-2.74%) |
133.01 |
127.25 - 133.61 |
1.1008 times |
Fri 24 October 2025 |
132.69 (2.61%) |
129.80 |
128.79 - 133.58 |
0.8208 times |
Fri 17 October 2025 |
129.32 (0.15%) |
126.33 |
126.33 - 131.97 |
0.8876 times |
Tue 07 October 2025 |
129.13 (-0.41%) |
129.79 |
125.42 - 130.70 |
0.197 times |
Fri 03 October 2025 |
129.66 (2.79%) |
126.36 |
124.16 - 133.11 |
0.8863 times |
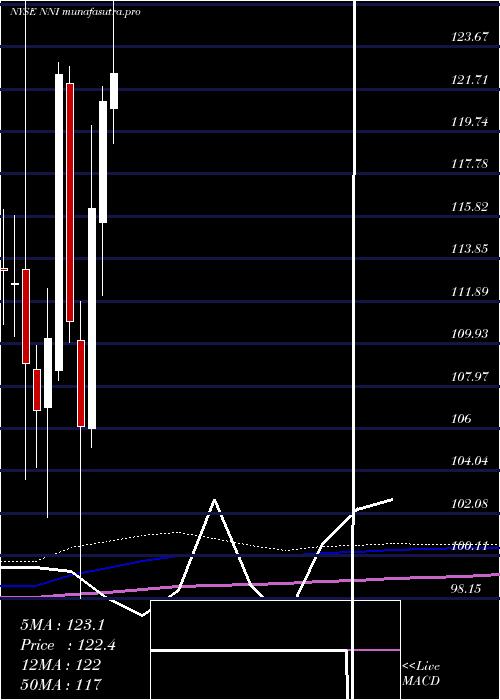
Monthly price and charts NelnetInc Strong monthly Stock price targets for NelnetInc NNI are 129.83 and 136.27 | Monthly Target 1 | 124.91 | | Monthly Target 2 | 128.3 | | Monthly Target 3 | 131.34666666667 | | Monthly Target 4 | 134.74 | | Monthly Target 5 | 137.79 |
Monthly price and volumes Nelnet Inc
| Date |
Closing |
Open |
Range |
Volume |
Thu 04 December 2025 |
131.70 (1.9%) |
128.28 |
127.95 - 134.39 |
0.3573 times |
Fri 28 November 2025 |
129.24 (0.15%) |
128.50 |
121.27 - 136.68 |
1.3812 times |
Fri 31 October 2025 |
129.05 (2.93%) |
125.45 |
124.87 - 133.61 |
0.9588 times |
Tue 30 September 2025 |
125.38 (-2.51%) |
127.48 |
122.24 - 136.17 |
1.3374 times |
Fri 29 August 2025 |
128.61 (3.08%) |
123.84 |
121.65 - 131.06 |
1.0242 times |
Thu 31 July 2025 |
124.77 (3.01%) |
120.83 |
117.92 - 127.07 |
1.4077 times |
Mon 30 June 2025 |
121.12 (4.25%) |
115.54 |
112.16 - 121.82 |
0.9744 times |
Fri 30 May 2025 |
116.18 (9.51%) |
106.00 |
105.12 - 120.01 |
1.0636 times |
Wed 30 April 2025 |
106.09 (-4.36%) |
110.08 |
98.15 - 111.85 |
0.6452 times |
Mon 31 March 2025 |
110.93 (-9.36%) |
121.94 |
109.97 - 122.74 |
0.8501 times |
Fri 28 February 2025 |
122.39 (11.09%) |
108.67 |
108.21 - 122.91 |
0.5248 times |
DMA SMA EMA moving averages of Nelnet Inc NNI
DMA (daily moving average) of Nelnet Inc NNI
| DMA period | DMA value | | 5 day DMA | 131.03 | | 12 day DMA | 128.77 | | 20 day DMA | 129.08 | | 35 day DMA | 129.51 | | 50 day DMA | 129.04 | | 100 day DMA | 127.14 | | 150 day DMA | 123.25 | | 200 day DMA | 120.17 | EMA (exponential moving average) of Nelnet Inc NNI
| EMA period | EMA current | EMA prev | EMA prev2 | | 5 day EMA | 131.19 | 130.94 | 129.82 | | 12 day EMA | 129.96 | 129.64 | 129 | | 20 day EMA | 129.5 | 129.27 | 128.86 | | 35 day EMA | 129.06 | 128.9 | 128.65 | | 50 day EMA | 128.99 | 128.88 | 128.7 |
SMA (simple moving average) of Nelnet Inc NNI
| SMA period | SMA current | SMA prev | SMA prev2 | | 5 day SMA | 131.03 | 130.77 | 130.1 | | 12 day SMA | 128.77 | 128.22 | 127.89 | | 20 day SMA | 129.08 | 128.99 | 128.86 | | 35 day SMA | 129.51 | 129.47 | 129.36 | | 50 day SMA | 129.04 | 128.95 | 128.85 | | 100 day SMA | 127.14 | 127.08 | 127 | | 150 day SMA | 123.25 | 123.08 | 122.9 | | 200 day SMA | 120.17 | 120.07 | 119.96 |
|
|
