NuveenMunicipal NMZ full analysis,charts,indicators,moving averages,SMA,DMA,EMA,ADX,MACD,RSINuveen Municipal NMZ WideScreen charts, DMA,SMA,EMA technical analysis, forecast prediction, by indicators ADX,MACD,RSI,CCI NYSE stock exchange
operates under N A sector & deals in N A
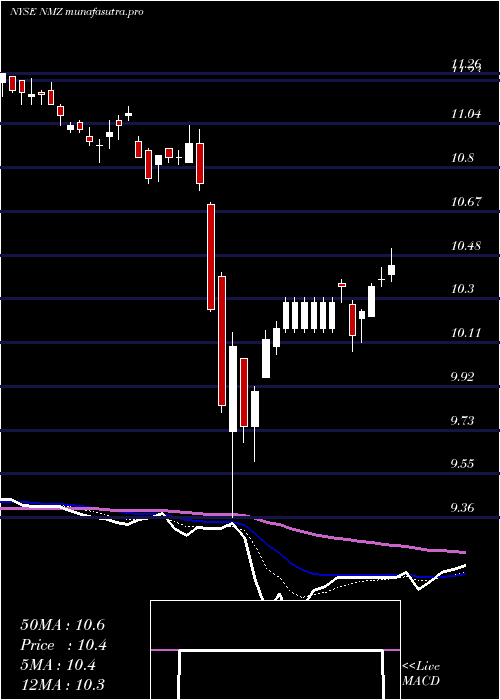
Daily price and charts and targets NuveenMunicipal Strong Daily Stock price targets for NuveenMunicipal NMZ are 10.5 and 10.6 | Daily Target 1 | 10.47 | | Daily Target 2 | 10.53 | | Daily Target 3 | 10.573333333333 | | Daily Target 4 | 10.63 | | Daily Target 5 | 10.67 |
Daily price and volume Nuveen Municipal
| Date |
Closing |
Open |
Range |
Volume |
Fri 05 December 2025 |
10.58 (-0.09%) |
10.62 |
10.52 - 10.62 |
1.2018 times |
Thu 04 December 2025 |
10.59 (-0.09%) |
10.62 |
10.56 - 10.62 |
1.4776 times |
Wed 03 December 2025 |
10.60 (-0.19%) |
10.64 |
10.58 - 10.64 |
1.5676 times |
Tue 02 December 2025 |
10.62 (0.19%) |
10.60 |
10.54 - 10.62 |
0.9899 times |
Mon 01 December 2025 |
10.60 (-0.47%) |
10.63 |
10.57 - 10.63 |
1.3089 times |
Fri 28 November 2025 |
10.65 (0.28%) |
10.65 |
10.59 - 10.65 |
0.4816 times |
Wed 26 November 2025 |
10.62 (-0.19%) |
10.63 |
10.59 - 10.66 |
0.8413 times |
Tue 25 November 2025 |
10.64 (0.28%) |
10.60 |
10.58 - 10.64 |
0.7025 times |
Mon 24 November 2025 |
10.61 (0.57%) |
10.60 |
10.56 - 10.63 |
0.7503 times |
Fri 21 November 2025 |
10.55 (0.09%) |
10.58 |
10.50 - 10.60 |
0.6785 times |
Thu 20 November 2025 |
10.54 (-0.75%) |
10.64 |
10.53 - 10.64 |
0.6642 times |
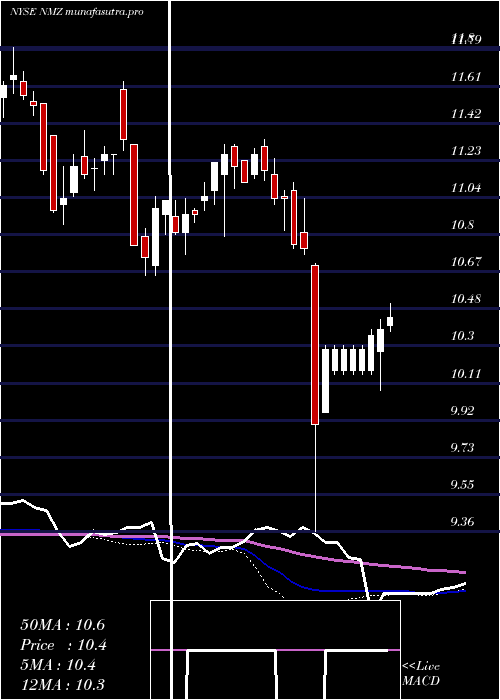
Weekly price and charts NuveenMunicipal Strong weekly Stock price targets for NuveenMunicipal NMZ are 10.49 and 10.61 | Weekly Target 1 | 10.46 | | Weekly Target 2 | 10.52 | | Weekly Target 3 | 10.58 | | Weekly Target 4 | 10.64 | | Weekly Target 5 | 10.7 |
Weekly price and volumes for Nuveen Municipal
| Date |
Closing |
Open |
Range |
Volume |
Fri 05 December 2025 |
10.58 (-0.66%) |
10.63 |
10.52 - 10.64 |
1.9216 times |
Fri 28 November 2025 |
10.65 (0.95%) |
10.60 |
10.56 - 10.66 |
0.8149 times |
Fri 21 November 2025 |
10.55 (-1.03%) |
10.67 |
10.50 - 10.72 |
1.1189 times |
Fri 14 November 2025 |
10.66 (0.57%) |
10.61 |
10.60 - 10.77 |
1.1997 times |
Fri 07 November 2025 |
10.60 (-0.47%) |
10.65 |
10.57 - 10.74 |
0.9539 times |
Fri 31 October 2025 |
10.65 (0%) |
10.60 |
10.59 - 10.66 |
0.2802 times |
Fri 31 October 2025 |
10.65 (1.04%) |
10.55 |
10.53 - 10.66 |
1.3008 times |
Fri 24 October 2025 |
10.54 (-0.28%) |
10.61 |
10.48 - 10.67 |
0.9467 times |
Fri 17 October 2025 |
10.57 (0%) |
10.68 |
10.51 - 10.75 |
1.0477 times |
Tue 07 October 2025 |
10.57 (0.09%) |
10.56 |
10.53 - 10.60 |
0.4156 times |
Fri 03 October 2025 |
10.56 (0.96%) |
10.50 |
10.42 - 10.65 |
1.2275 times |
Monthly price and charts NuveenMunicipal Strong monthly Stock price targets for NuveenMunicipal NMZ are 10.49 and 10.61 | Monthly Target 1 | 10.46 | | Monthly Target 2 | 10.52 | | Monthly Target 3 | 10.58 | | Monthly Target 4 | 10.64 | | Monthly Target 5 | 10.7 |
Monthly price and volumes Nuveen Municipal
| Date |
Closing |
Open |
Range |
Volume |
Fri 05 December 2025 |
10.58 (-0.66%) |
10.63 |
10.52 - 10.64 |
0.4136 times |
Fri 28 November 2025 |
10.65 (0%) |
10.65 |
10.50 - 10.77 |
0.8798 times |
Fri 31 October 2025 |
10.65 (0.57%) |
10.61 |
10.48 - 10.75 |
1.0367 times |
Tue 30 September 2025 |
10.59 (4.54%) |
10.10 |
10.02 - 10.66 |
1.1865 times |
Fri 29 August 2025 |
10.13 (2.01%) |
9.97 |
9.92 - 10.18 |
1.0545 times |
Thu 31 July 2025 |
9.93 (-4.24%) |
10.35 |
9.83 - 10.48 |
1.2215 times |
Mon 30 June 2025 |
10.37 (-0.29%) |
10.40 |
10.18 - 10.45 |
0.8254 times |
Fri 30 May 2025 |
10.40 (-1.23%) |
10.57 |
10.19 - 10.67 |
0.8811 times |
Wed 30 April 2025 |
10.53 (-3.48%) |
10.94 |
9.36 - 11.04 |
1.7553 times |
Mon 31 March 2025 |
10.91 (-3.11%) |
11.30 |
10.79 - 11.34 |
0.7456 times |
Fri 28 February 2025 |
11.26 (0.36%) |
11.16 |
10.85 - 11.31 |
0.8783 times |

DMA SMA EMA moving averages of Nuveen Municipal NMZ
DMA (daily moving average) of Nuveen Municipal NMZ
| DMA period | DMA value | | 5 day DMA | 10.6 | | 12 day DMA | 10.6 | | 20 day DMA | 10.63 | | 35 day DMA | 10.62 | | 50 day DMA | 10.6 | | 100 day DMA | 10.38 | | 150 day DMA | 10.38 | | 200 day DMA | 10.47 | EMA (exponential moving average) of Nuveen Municipal NMZ
| EMA period | EMA current | EMA prev | EMA prev2 | | 5 day EMA | 10.59 | 10.6 | 10.61 | | 12 day EMA | 10.61 | 10.62 | 10.63 | | 20 day EMA | 10.62 | 10.62 | 10.62 | | 35 day EMA | 10.62 | 10.62 | 10.62 | | 50 day EMA | 10.6 | 10.6 | 10.6 |
SMA (simple moving average) of Nuveen Municipal NMZ
| SMA period | SMA current | SMA prev | SMA prev2 | | 5 day SMA | 10.6 | 10.61 | 10.62 | | 12 day SMA | 10.6 | 10.61 | 10.61 | | 20 day SMA | 10.63 | 10.63 | 10.64 | | 35 day SMA | 10.62 | 10.62 | 10.62 | | 50 day SMA | 10.6 | 10.6 | 10.6 | | 100 day SMA | 10.38 | 10.37 | 10.37 | | 150 day SMA | 10.38 | 10.38 | 10.38 | | 200 day SMA | 10.47 | 10.48 | 10.48 |
|
|
