NuveenMassachusetts NMT full analysis,charts,indicators,moving averages,SMA,DMA,EMA,ADX,MACD,RSINuveen Massachusetts NMT WideScreen charts, DMA,SMA,EMA technical analysis, forecast prediction, by indicators ADX,MACD,RSI,CCI NYSE stock exchange
operates under N A sector & deals in N A
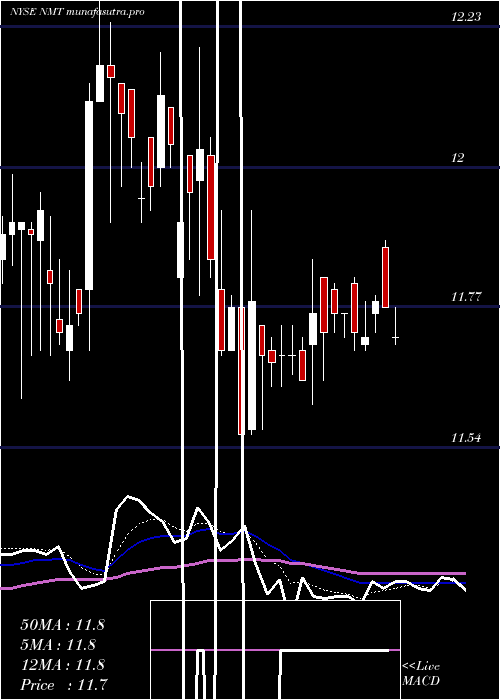
Daily price and charts and targets NuveenMassachusetts Strong Daily Stock price targets for NuveenMassachusetts NMT are 11.53 and 11.57 | Daily Target 1 | 11.5 | | Daily Target 2 | 11.52 | | Daily Target 3 | 11.536666666667 | | Daily Target 4 | 11.56 | | Daily Target 5 | 11.58 |
Daily price and volume Nuveen Massachusetts
| Date |
Closing |
Open |
Range |
Volume |
Tue 21 October 2025 |
11.55 (0.17%) |
11.53 |
11.51 - 11.55 |
0.6177 times |
Mon 20 October 2025 |
11.53 (-0.09%) |
11.55 |
11.50 - 11.55 |
0.9444 times |
Fri 17 October 2025 |
11.54 (0.09%) |
11.50 |
11.50 - 11.60 |
0.8138 times |
Thu 16 October 2025 |
11.53 (0%) |
11.55 |
11.49 - 11.55 |
1.3959 times |
Wed 15 October 2025 |
11.53 (-0.26%) |
11.54 |
11.53 - 11.57 |
2.0255 times |
Tue 14 October 2025 |
11.56 (-0.17%) |
11.61 |
11.55 - 11.61 |
0.2792 times |
Mon 13 October 2025 |
11.58 (0.09%) |
11.61 |
11.55 - 11.61 |
0.7247 times |
Tue 07 October 2025 |
11.57 (-0.6%) |
11.61 |
11.52 - 11.66 |
1.1167 times |
Mon 06 October 2025 |
11.64 (0.95%) |
11.64 |
11.55 - 11.67 |
0.722 times |
Fri 03 October 2025 |
11.53 (-0.35%) |
11.57 |
11.51 - 11.60 |
1.3602 times |
Thu 02 October 2025 |
11.57 (-0.34%) |
11.63 |
11.57 - 11.68 |
0.683 times |
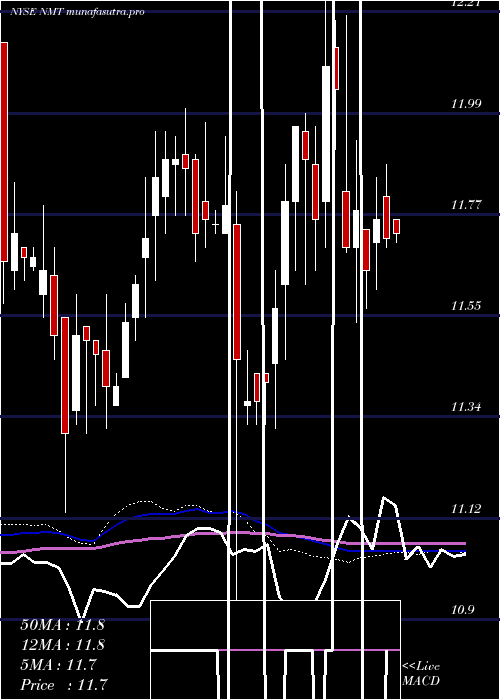
Weekly price and charts NuveenMassachusetts Strong weekly Stock price targets for NuveenMassachusetts NMT are 11.53 and 11.58 | Weekly Target 1 | 11.48 | | Weekly Target 2 | 11.52 | | Weekly Target 3 | 11.533333333333 | | Weekly Target 4 | 11.57 | | Weekly Target 5 | 11.58 |
Weekly price and volumes for Nuveen Massachusetts
| Date |
Closing |
Open |
Range |
Volume |
Tue 21 October 2025 |
11.55 (0.09%) |
11.55 |
11.50 - 11.55 |
0.3698 times |
Fri 17 October 2025 |
11.54 (-0.26%) |
11.61 |
11.49 - 11.61 |
1.2401 times |
Tue 07 October 2025 |
11.57 (0.35%) |
11.64 |
11.52 - 11.67 |
0.4352 times |
Fri 03 October 2025 |
11.53 (-0.52%) |
11.69 |
11.51 - 11.72 |
1.3019 times |
Fri 26 September 2025 |
11.59 (0%) |
11.62 |
11.57 - 11.77 |
1.0953 times |
Fri 19 September 2025 |
11.59 (-0.17%) |
11.60 |
11.52 - 11.69 |
1.406 times |
Fri 12 September 2025 |
11.61 (0.69%) |
11.53 |
11.49 - 11.67 |
1.1023 times |
Fri 05 September 2025 |
11.53 (1.77%) |
11.38 |
11.24 - 11.58 |
1.2837 times |
Fri 29 August 2025 |
11.33 (0%) |
11.21 |
11.19 - 11.38 |
0.367 times |
Fri 29 August 2025 |
11.33 (1.43%) |
11.18 |
11.13 - 11.38 |
1.3989 times |
Fri 22 August 2025 |
11.17 (-1.06%) |
11.27 |
11.14 - 11.32 |
1.3497 times |
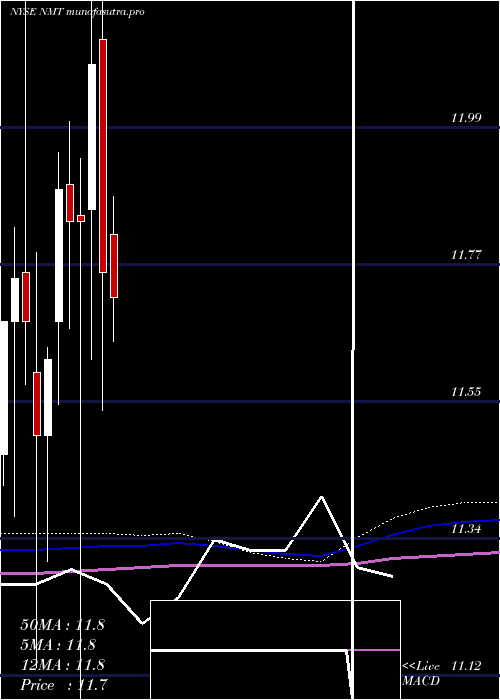
Monthly price and charts NuveenMassachusetts Strong monthly Stock price targets for NuveenMassachusetts NMT are 11.41 and 11.64 | Monthly Target 1 | 11.36 | | Monthly Target 2 | 11.45 | | Monthly Target 3 | 11.586666666667 | | Monthly Target 4 | 11.68 | | Monthly Target 5 | 11.82 |
Monthly price and volumes Nuveen Massachusetts
| Date |
Closing |
Open |
Range |
Volume |
Tue 21 October 2025 |
11.55 (-0.86%) |
11.72 |
11.49 - 11.72 |
0.578 times |
Tue 30 September 2025 |
11.65 (2.82%) |
11.38 |
11.24 - 11.77 |
1.0184 times |
Fri 29 August 2025 |
11.33 (0%) |
11.43 |
11.13 - 11.49 |
1.0732 times |
Thu 31 July 2025 |
11.33 (-3.66%) |
11.82 |
11.30 - 11.88 |
1.2641 times |
Mon 30 June 2025 |
11.76 (-2.73%) |
12.13 |
11.54 - 12.20 |
0.9244 times |
Fri 30 May 2025 |
12.09 (2.11%) |
11.86 |
11.62 - 12.33 |
1.0243 times |
Wed 30 April 2025 |
11.84 (0%) |
11.85 |
10.90 - 11.94 |
1.382 times |
Mon 31 March 2025 |
11.84 (-0.42%) |
11.90 |
11.67 - 12.00 |
0.8229 times |
Fri 28 February 2025 |
11.89 (2.32%) |
11.68 |
11.55 - 11.95 |
0.6766 times |
Fri 31 January 2025 |
11.62 (1.04%) |
11.50 |
11.30 - 11.64 |
1.2362 times |
Tue 31 December 2024 |
11.50 (-1.54%) |
11.60 |
11.13 - 11.79 |
1.6165 times |
DMA SMA EMA moving averages of Nuveen Massachusetts NMT
DMA (daily moving average) of Nuveen Massachusetts NMT
| DMA period | DMA value | | 5 day DMA | 11.54 | | 12 day DMA | 11.56 | | 20 day DMA | 11.59 | | 35 day DMA | 11.56 | | 50 day DMA | 11.47 | | 100 day DMA | 11.58 | | 150 day DMA | 11.62 | | 200 day DMA | 11.64 | EMA (exponential moving average) of Nuveen Massachusetts NMT
| EMA period | EMA current | EMA prev | EMA prev2 | | 5 day EMA | 11.54 | 11.54 | 11.55 | | 12 day EMA | 11.56 | 11.56 | 11.57 | | 20 day EMA | 11.58 | 11.58 | 11.58 | | 35 day EMA | 11.5 | 11.5 | 11.5 | | 50 day EMA | 11.45 | 11.45 | 11.45 |
SMA (simple moving average) of Nuveen Massachusetts NMT
| SMA period | SMA current | SMA prev | SMA prev2 | | 5 day SMA | 11.54 | 11.54 | 11.55 | | 12 day SMA | 11.56 | 11.57 | 11.58 | | 20 day SMA | 11.59 | 11.59 | 11.6 | | 35 day SMA | 11.56 | 11.55 | 11.54 | | 50 day SMA | 11.47 | 11.47 | 11.46 | | 100 day SMA | 11.58 | 11.59 | 11.59 | | 150 day SMA | 11.62 | 11.63 | 11.63 | | 200 day SMA | 11.64 | 11.63 | 11.63 |
|
|
