NuveenMunicipal NMI full analysis,charts,indicators,moving averages,SMA,DMA,EMA,ADX,MACD,RSINuveen Municipal NMI WideScreen charts, DMA,SMA,EMA technical analysis, forecast prediction, by indicators ADX,MACD,RSI,CCI NYSE stock exchange
operates under N A sector & deals in N A
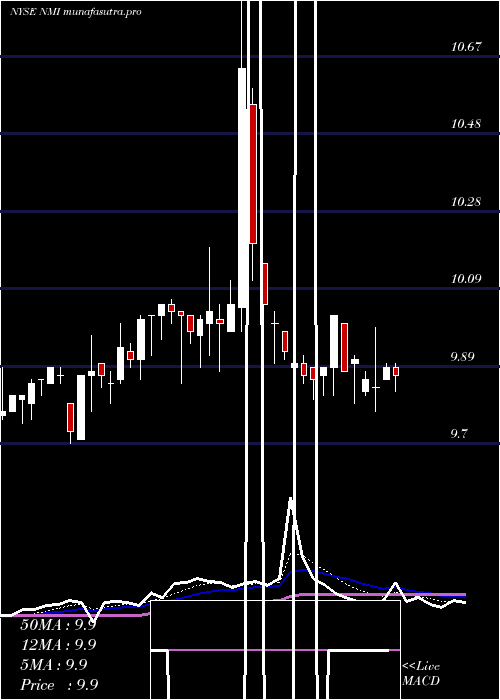
Daily price and charts and targets NuveenMunicipal Strong Daily Stock price targets for NuveenMunicipal NMI are 9.96 and 10.06 | Daily Target 1 | 9.94 | | Daily Target 2 | 9.98 | | Daily Target 3 | 10.043333333333 | | Daily Target 4 | 10.08 | | Daily Target 5 | 10.14 |
Daily price and volume Nuveen Municipal
| Date |
Closing |
Open |
Range |
Volume |
Tue 21 October 2025 |
10.01 (-0.1%) |
10.03 |
10.01 - 10.11 |
0.3632 times |
Mon 20 October 2025 |
10.02 (0.2%) |
10.02 |
10.01 - 10.02 |
0.8187 times |
Fri 17 October 2025 |
10.00 (-0.2%) |
9.98 |
9.98 - 10.02 |
1.2189 times |
Thu 16 October 2025 |
10.02 (0.1%) |
10.00 |
9.98 - 10.02 |
1.1942 times |
Wed 15 October 2025 |
10.01 (-0.2%) |
10.00 |
9.97 - 10.02 |
1.2866 times |
Tue 14 October 2025 |
10.03 (0.2%) |
10.01 |
10.00 - 10.03 |
0.9849 times |
Mon 13 October 2025 |
10.01 (0%) |
9.98 |
9.98 - 10.01 |
0.7141 times |
Tue 07 October 2025 |
10.01 (0.2%) |
9.98 |
9.98 - 10.29 |
1.6929 times |
Mon 06 October 2025 |
9.99 (0.1%) |
9.98 |
9.95 - 9.99 |
0.9693 times |
Fri 03 October 2025 |
9.98 (-0.4%) |
10.00 |
9.95 - 10.02 |
0.7572 times |
Thu 02 October 2025 |
10.02 (0.91%) |
9.93 |
9.90 - 10.13 |
2.4466 times |
Weekly price and charts NuveenMunicipal Strong weekly Stock price targets for NuveenMunicipal NMI are 9.96 and 10.06 | Weekly Target 1 | 9.94 | | Weekly Target 2 | 9.98 | | Weekly Target 3 | 10.043333333333 | | Weekly Target 4 | 10.08 | | Weekly Target 5 | 10.14 |
Weekly price and volumes for Nuveen Municipal
| Date |
Closing |
Open |
Range |
Volume |
Tue 21 October 2025 |
10.01 (0.1%) |
10.02 |
10.01 - 10.11 |
0.1911 times |
Fri 17 October 2025 |
10.00 (-0.1%) |
9.98 |
9.97 - 10.03 |
0.8727 times |
Tue 07 October 2025 |
10.01 (0.3%) |
9.98 |
9.95 - 10.29 |
0.4304 times |
Fri 03 October 2025 |
9.98 (0.81%) |
9.84 |
9.84 - 10.13 |
1.1777 times |
Fri 26 September 2025 |
9.90 (-0.1%) |
9.86 |
9.84 - 9.95 |
0.6021 times |
Fri 19 September 2025 |
9.91 (0.3%) |
9.89 |
9.84 - 9.93 |
1.225 times |
Fri 12 September 2025 |
9.88 (1.33%) |
9.74 |
9.74 - 9.90 |
1.644 times |
Fri 05 September 2025 |
9.75 (1.04%) |
9.66 |
9.62 - 9.83 |
2.1027 times |
Fri 29 August 2025 |
9.65 (0%) |
9.67 |
9.65 - 9.70 |
0.3115 times |
Fri 29 August 2025 |
9.65 (-1.23%) |
9.78 |
9.65 - 9.93 |
1.4429 times |
Fri 22 August 2025 |
9.77 (-0.1%) |
9.79 |
9.66 - 9.82 |
1.636 times |

Monthly price and charts NuveenMunicipal Strong monthly Stock price targets for NuveenMunicipal NMI are 9.95 and 10.35 | Monthly Target 1 | 9.66 | | Monthly Target 2 | 9.84 | | Monthly Target 3 | 10.063333333333 | | Monthly Target 4 | 10.24 | | Monthly Target 5 | 10.46 |
Monthly price and volumes Nuveen Municipal
| Date |
Closing |
Open |
Range |
Volume |
Tue 21 October 2025 |
10.01 (1.01%) |
9.92 |
9.89 - 10.29 |
0.3896 times |
Tue 30 September 2025 |
9.91 (2.69%) |
9.66 |
9.62 - 9.95 |
1.0593 times |
Fri 29 August 2025 |
9.65 (-2.43%) |
9.89 |
9.65 - 10.05 |
1.1053 times |
Thu 31 July 2025 |
9.89 (-1.59%) |
10.05 |
9.78 - 10.85 |
2.2496 times |
Mon 30 June 2025 |
10.05 (2.87%) |
9.78 |
9.70 - 10.05 |
0.961 times |
Fri 30 May 2025 |
9.77 (0.72%) |
9.80 |
9.61 - 10.03 |
0.9942 times |
Wed 30 April 2025 |
9.70 (-1.42%) |
9.88 |
9.21 - 10.00 |
0.8071 times |
Mon 31 March 2025 |
9.84 (-1.01%) |
9.96 |
9.66 - 9.98 |
0.7698 times |
Fri 28 February 2025 |
9.94 (1.12%) |
9.88 |
9.66 - 9.99 |
0.859 times |
Fri 31 January 2025 |
9.83 (4.46%) |
9.44 |
9.40 - 9.86 |
0.8051 times |
Tue 31 December 2024 |
9.41 (-1.57%) |
9.59 |
9.29 - 9.69 |
1.3048 times |

DMA SMA EMA moving averages of Nuveen Municipal NMI
DMA (daily moving average) of Nuveen Municipal NMI
| DMA period | DMA value | | 5 day DMA | 10.01 | | 12 day DMA | 10 | | 20 day DMA | 9.96 | | 35 day DMA | 9.89 | | 50 day DMA | 9.85 | | 100 day DMA | 9.88 | | 150 day DMA | 9.83 | | 200 day DMA | 9.81 | EMA (exponential moving average) of Nuveen Municipal NMI
| EMA period | EMA current | EMA prev | EMA prev2 | | 5 day EMA | 10.01 | 10.01 | 10.01 | | 12 day EMA | 9.99 | 9.99 | 9.98 | | 20 day EMA | 9.96 | 9.96 | 9.95 | | 35 day EMA | 9.93 | 9.93 | 9.92 | | 50 day EMA | 9.89 | 9.88 | 9.87 |
SMA (simple moving average) of Nuveen Municipal NMI
| SMA period | SMA current | SMA prev | SMA prev2 | | 5 day SMA | 10.01 | 10.02 | 10.01 | | 12 day SMA | 10 | 9.99 | 9.98 | | 20 day SMA | 9.96 | 9.95 | 9.95 | | 35 day SMA | 9.89 | 9.88 | 9.87 | | 50 day SMA | 9.85 | 9.85 | 9.84 | | 100 day SMA | 9.88 | 9.88 | 9.87 | | 150 day SMA | 9.83 | 9.83 | 9.83 | | 200 day SMA | 9.81 | 9.81 | 9.81 |
|
|
