NuveenMunicipal NMCO full analysis,charts,indicators,moving averages,SMA,DMA,EMA,ADX,MACD,RSINuveen Municipal NMCO WideScreen charts, DMA,SMA,EMA technical analysis, forecast prediction, by indicators ADX,MACD,RSI,CCI NYSE stock exchange
Daily price and charts and targets NuveenMunicipal Strong Daily Stock price targets for NuveenMunicipal NMCO are 10.72 and 10.79 | Daily Target 1 | 10.66 | | Daily Target 2 | 10.71 | | Daily Target 3 | 10.733333333333 | | Daily Target 4 | 10.78 | | Daily Target 5 | 10.8 |
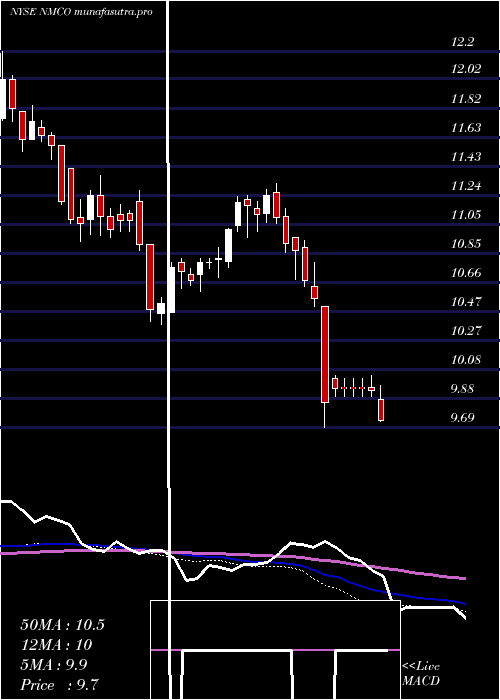
Daily price and volume Nuveen Municipal
| Date |
Closing |
Open |
Range |
Volume |
Fri 05 December 2025 |
10.75 (0.37%) |
10.70 |
10.69 - 10.76 |
0.5344 times |
Thu 04 December 2025 |
10.71 (0.47%) |
10.68 |
10.66 - 10.74 |
0.9845 times |
Wed 03 December 2025 |
10.66 (0.38%) |
10.62 |
10.60 - 10.70 |
1.0704 times |
Tue 02 December 2025 |
10.62 (-0.09%) |
10.66 |
10.59 - 10.66 |
1.1308 times |
Mon 01 December 2025 |
10.63 (-0.19%) |
10.63 |
10.55 - 10.68 |
1.133 times |
Fri 28 November 2025 |
10.65 (0.47%) |
10.60 |
10.53 - 10.66 |
0.6081 times |
Wed 26 November 2025 |
10.60 (-0.19%) |
10.67 |
10.52 - 10.67 |
1.1558 times |
Tue 25 November 2025 |
10.62 (0.95%) |
10.56 |
10.50 - 10.63 |
1.4845 times |
Mon 24 November 2025 |
10.52 (-0.09%) |
10.52 |
10.50 - 10.57 |
1.0524 times |
Fri 21 November 2025 |
10.53 (-0.47%) |
10.58 |
10.46 - 10.60 |
0.8461 times |
Thu 20 November 2025 |
10.58 (-1.49%) |
10.69 |
10.58 - 10.70 |
0.5715 times |

Weekly price and charts NuveenMunicipal Strong weekly Stock price targets for NuveenMunicipal NMCO are 10.65 and 10.86 | Weekly Target 1 | 10.48 | | Weekly Target 2 | 10.61 | | Weekly Target 3 | 10.686666666667 | | Weekly Target 4 | 10.82 | | Weekly Target 5 | 10.9 |
Weekly price and volumes for Nuveen Municipal
| Date |
Closing |
Open |
Range |
Volume |
Fri 05 December 2025 |
10.75 (0.94%) |
10.63 |
10.55 - 10.76 |
1.5298 times |
Fri 28 November 2025 |
10.65 (1.14%) |
10.52 |
10.50 - 10.67 |
1.3556 times |
Fri 21 November 2025 |
10.53 (-3.04%) |
10.88 |
10.46 - 10.88 |
1.0822 times |
Fri 14 November 2025 |
10.86 (-0.37%) |
10.86 |
10.75 - 10.96 |
1.1656 times |
Fri 07 November 2025 |
10.90 (-0.27%) |
10.91 |
10.85 - 10.97 |
0.919 times |
Fri 31 October 2025 |
10.93 (0%) |
10.79 |
10.78 - 10.94 |
0.2224 times |
Fri 31 October 2025 |
10.93 (1.96%) |
10.79 |
10.67 - 10.94 |
1.2111 times |
Fri 24 October 2025 |
10.72 (-0.83%) |
10.85 |
10.60 - 10.98 |
1.3302 times |
Fri 17 October 2025 |
10.81 (0.19%) |
10.87 |
10.75 - 10.93 |
0.685 times |
Tue 07 October 2025 |
10.79 (-0.19%) |
10.80 |
10.74 - 10.84 |
0.499 times |
Fri 03 October 2025 |
10.81 (-0.83%) |
10.93 |
10.68 - 10.99 |
1.3129 times |
Monthly price and charts NuveenMunicipal Strong monthly Stock price targets for NuveenMunicipal NMCO are 10.65 and 10.86 | Monthly Target 1 | 10.48 | | Monthly Target 2 | 10.61 | | Monthly Target 3 | 10.686666666667 | | Monthly Target 4 | 10.82 | | Monthly Target 5 | 10.9 |
Monthly price and volumes Nuveen Municipal
| Date |
Closing |
Open |
Range |
Volume |
Fri 05 December 2025 |
10.75 (0.94%) |
10.63 |
10.55 - 10.76 |
0.2939 times |
Fri 28 November 2025 |
10.65 (-2.56%) |
10.91 |
10.46 - 10.97 |
0.869 times |
Fri 31 October 2025 |
10.93 (0.64%) |
10.91 |
10.60 - 10.99 |
0.9173 times |
Tue 30 September 2025 |
10.86 (5.03%) |
10.33 |
10.25 - 10.94 |
1.0587 times |
Fri 29 August 2025 |
10.34 (2.99%) |
10.10 |
10.07 - 10.40 |
1.2382 times |
Thu 31 July 2025 |
10.04 (-6.43%) |
10.80 |
9.95 - 10.91 |
1.3241 times |
Mon 30 June 2025 |
10.73 (1.8%) |
10.55 |
10.35 - 10.83 |
0.9297 times |
Fri 30 May 2025 |
10.54 (2.73%) |
10.26 |
10.10 - 11.20 |
0.9814 times |
Wed 30 April 2025 |
10.26 (-4.11%) |
10.75 |
9.69 - 10.79 |
1.5945 times |
Mon 31 March 2025 |
10.70 (-4.8%) |
11.26 |
10.55 - 11.32 |
0.793 times |
Fri 28 February 2025 |
11.24 (2.09%) |
11.04 |
10.96 - 11.28 |
0.8433 times |

DMA SMA EMA moving averages of Nuveen Municipal NMCO
DMA (daily moving average) of Nuveen Municipal NMCO
| DMA period | DMA value | | 5 day DMA | 10.67 | | 12 day DMA | 10.63 | | 20 day DMA | 10.73 | | 35 day DMA | 10.78 | | 50 day DMA | 10.8 | | 100 day DMA | 10.58 | | 150 day DMA | 10.55 | | 200 day DMA | 10.56 | EMA (exponential moving average) of Nuveen Municipal NMCO
| EMA period | EMA current | EMA prev | EMA prev2 | | 5 day EMA | 10.69 | 10.66 | 10.63 | | 12 day EMA | 10.68 | 10.67 | 10.66 | | 20 day EMA | 10.71 | 10.71 | 10.71 | | 35 day EMA | 10.74 | 10.74 | 10.74 | | 50 day EMA | 10.79 | 10.79 | 10.79 |
SMA (simple moving average) of Nuveen Municipal NMCO
| SMA period | SMA current | SMA prev | SMA prev2 | | 5 day SMA | 10.67 | 10.65 | 10.63 | | 12 day SMA | 10.63 | 10.64 | 10.65 | | 20 day SMA | 10.73 | 10.74 | 10.75 | | 35 day SMA | 10.78 | 10.78 | 10.78 | | 50 day SMA | 10.8 | 10.8 | 10.81 | | 100 day SMA | 10.58 | 10.58 | 10.58 | | 150 day SMA | 10.55 | 10.54 | 10.54 | | 200 day SMA | 10.56 | 10.57 | 10.57 |
|
|
