NikeInc NKE full analysis,charts,indicators,moving averages,SMA,DMA,EMA,ADX,MACD,RSINike Inc NKE WideScreen charts, DMA,SMA,EMA technical analysis, forecast prediction, by indicators ADX,MACD,RSI,CCI NYSE stock exchange
operates under Consumer Non Durables sector & deals in Shoe Manufacturing
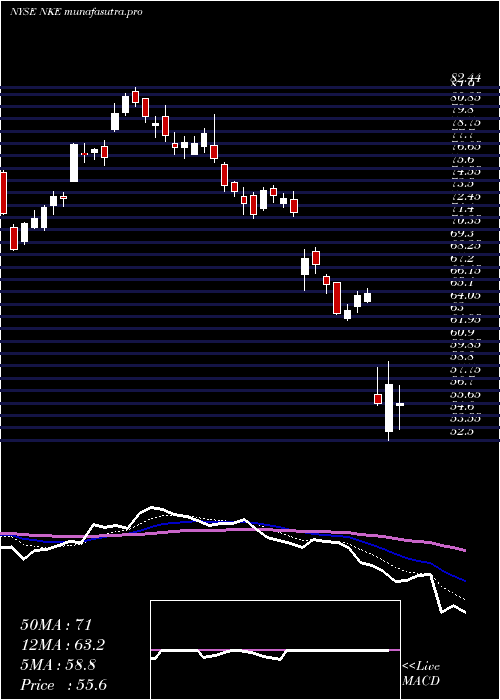
Daily price and charts and targets NikeInc Strong Daily Stock price targets for NikeInc NKE are 65.36 and 66.45 | Daily Target 1 | 64.51 | | Daily Target 2 | 65.11 | | Daily Target 3 | 65.603333333333 | | Daily Target 4 | 66.2 | | Daily Target 5 | 66.69 |
Daily price and volume Nike Inc
| Date |
Closing |
Open |
Range |
Volume |
Thu 04 December 2025 |
65.70 (0.08%) |
65.67 |
65.01 - 66.10 |
0.763 times |
Wed 03 December 2025 |
65.65 (1.12%) |
65.08 |
64.98 - 66.66 |
1.3771 times |
Tue 02 December 2025 |
64.92 (-0.72%) |
65.48 |
64.58 - 65.79 |
0.6441 times |
Mon 01 December 2025 |
65.39 (1.18%) |
63.77 |
63.58 - 65.99 |
1.3792 times |
Fri 28 November 2025 |
64.63 (0.47%) |
64.47 |
63.97 - 64.78 |
0.5657 times |
Wed 26 November 2025 |
64.33 (0.97%) |
63.99 |
62.97 - 64.87 |
0.7407 times |
Tue 25 November 2025 |
63.71 (2.87%) |
62.28 |
61.87 - 64.12 |
0.8011 times |
Mon 24 November 2025 |
61.93 (-1.39%) |
63.00 |
61.93 - 63.12 |
0.7112 times |
Fri 21 November 2025 |
62.80 (2.23%) |
62.01 |
61.54 - 63.50 |
1.4279 times |
Thu 20 November 2025 |
61.43 (-1.93%) |
62.95 |
61.41 - 63.83 |
1.5899 times |
Wed 19 November 2025 |
62.64 (0.26%) |
62.42 |
62.01 - 63.22 |
1.3432 times |
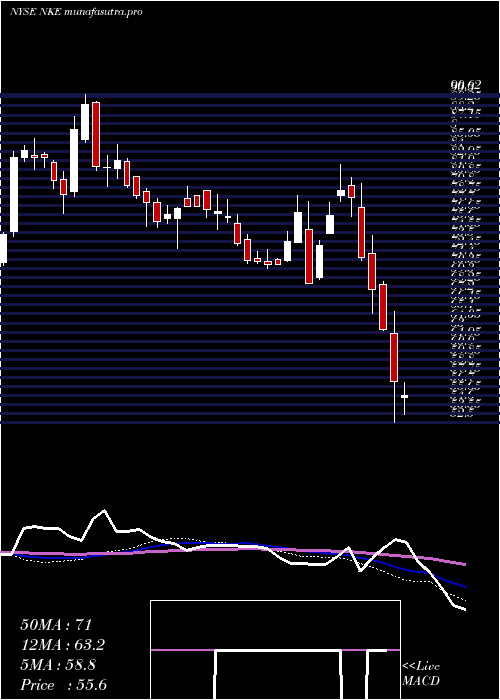
Weekly price and charts NikeInc Strong weekly Stock price targets for NikeInc NKE are 64.64 and 67.72 | Weekly Target 1 | 62.23 | | Weekly Target 2 | 63.97 | | Weekly Target 3 | 65.313333333333 | | Weekly Target 4 | 67.05 | | Weekly Target 5 | 68.39 |
Weekly price and volumes for Nike Inc
| Date |
Closing |
Open |
Range |
Volume |
Thu 04 December 2025 |
65.70 (1.66%) |
63.77 |
63.58 - 66.66 |
0.806 times |
Fri 28 November 2025 |
64.63 (2.91%) |
63.00 |
61.87 - 64.87 |
0.5457 times |
Fri 21 November 2025 |
62.80 (-2.13%) |
63.07 |
61.41 - 63.83 |
1.391 times |
Fri 14 November 2025 |
64.17 (5.08%) |
61.75 |
60.49 - 66.26 |
1.6312 times |
Fri 07 November 2025 |
61.07 (-5.45%) |
62.48 |
60.29 - 62.85 |
1.0945 times |
Fri 31 October 2025 |
64.59 (0%) |
65.00 |
64.25 - 65.25 |
0.395 times |
Fri 31 October 2025 |
64.59 (-6.55%) |
70.04 |
64.25 - 70.44 |
1.5061 times |
Fri 24 October 2025 |
69.12 (2.6%) |
67.90 |
67.41 - 70.14 |
0.65 times |
Fri 17 October 2025 |
67.37 (-2.23%) |
65.70 |
65.55 - 69.53 |
1.3533 times |
Tue 07 October 2025 |
68.91 (-4.29%) |
72.17 |
68.90 - 72.60 |
0.627 times |
Fri 03 October 2025 |
72.00 (3.88%) |
69.77 |
68.74 - 76.97 |
3.3759 times |
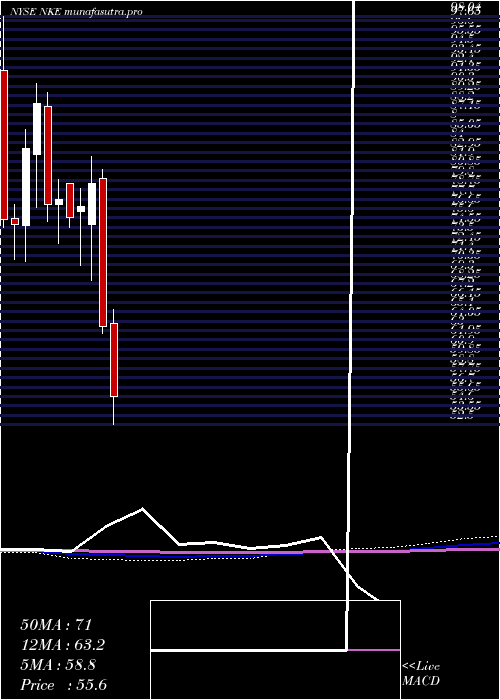
Monthly price and charts NikeInc Strong monthly Stock price targets for NikeInc NKE are 64.64 and 67.72 | Monthly Target 1 | 62.23 | | Monthly Target 2 | 63.97 | | Monthly Target 3 | 65.313333333333 | | Monthly Target 4 | 67.05 | | Monthly Target 5 | 68.39 |
Monthly price and volumes Nike Inc
| Date |
Closing |
Open |
Range |
Volume |
Thu 04 December 2025 |
65.70 (1.66%) |
63.77 |
63.58 - 66.66 |
0.1235 times |
Fri 28 November 2025 |
64.63 (0.06%) |
62.48 |
60.29 - 66.26 |
0.7143 times |
Fri 31 October 2025 |
64.59 (-7.37%) |
74.35 |
64.25 - 76.97 |
1.0122 times |
Tue 30 September 2025 |
69.73 (-9.87%) |
75.64 |
68.03 - 76.05 |
1.0269 times |
Fri 29 August 2025 |
77.37 (3.59%) |
73.44 |
72.53 - 80.17 |
0.66 times |
Thu 31 July 2025 |
74.69 (5.14%) |
71.99 |
71.03 - 79.99 |
1.0985 times |
Mon 30 June 2025 |
71.04 (17.25%) |
60.05 |
59.19 - 74.19 |
1.3509 times |
Fri 30 May 2025 |
60.59 (7.43%) |
56.68 |
56.26 - 63.75 |
1.0714 times |
Wed 30 April 2025 |
56.40 (-11.15%) |
63.83 |
52.28 - 65.40 |
1.8175 times |
Mon 31 March 2025 |
63.48 (-20.08%) |
79.99 |
62.65 - 80.96 |
1.1248 times |
Fri 28 February 2025 |
79.43 (3.29%) |
74.90 |
68.62 - 82.44 |
0.9755 times |
DMA SMA EMA moving averages of Nike Inc NKE
DMA (daily moving average) of Nike Inc NKE
| DMA period | DMA value | | 5 day DMA | 65.26 | | 12 day DMA | 63.8 | | 20 day DMA | 63.49 | | 35 day DMA | 64.76 | | 50 day DMA | 66.45 | | 100 day DMA | 70.78 | | 150 day DMA | 68.25 | | 200 day DMA | 67.91 | EMA (exponential moving average) of Nike Inc NKE
| EMA period | EMA current | EMA prev | EMA prev2 | | 5 day EMA | 65.16 | 64.89 | 64.51 | | 12 day EMA | 64.44 | 64.21 | 63.95 | | 20 day EMA | 64.42 | 64.28 | 64.14 | | 35 day EMA | 65.46 | 65.45 | 65.44 | | 50 day EMA | 66.8 | 66.85 | 66.9 |
SMA (simple moving average) of Nike Inc NKE
| SMA period | SMA current | SMA prev | SMA prev2 | | 5 day SMA | 65.26 | 64.98 | 64.6 | | 12 day SMA | 63.8 | 63.57 | 63.44 | | 20 day SMA | 63.49 | 63.31 | 63.09 | | 35 day SMA | 64.76 | 64.84 | 64.9 | | 50 day SMA | 66.45 | 66.55 | 66.68 | | 100 day SMA | 70.78 | 70.87 | 70.95 | | 150 day SMA | 68.25 | 68.19 | 68.15 | | 200 day SMA | 67.91 | 67.95 | 67.98 |
|
|
