NewjerseyResources NJR full analysis,charts,indicators,moving averages,SMA,DMA,EMA,ADX,MACD,RSINewjersey Resources NJR WideScreen charts, DMA,SMA,EMA technical analysis, forecast prediction, by indicators ADX,MACD,RSI,CCI NYSE stock exchange
operates under Public Utilities sector & deals in Oil Gas Transmission
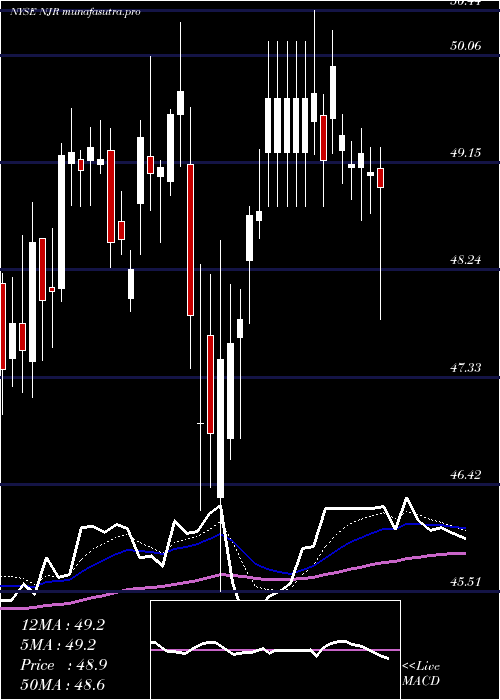
Daily price and charts and targets NewjerseyResources Strong Daily Stock price targets for NewjerseyResources NJR are 44.47 and 45.49 | Daily Target 1 | 44.28 | | Daily Target 2 | 44.65 | | Daily Target 3 | 45.3 | | Daily Target 4 | 45.67 | | Daily Target 5 | 46.32 |
Daily price and volume Newjersey Resources
| Date |
Closing |
Open |
Range |
Volume |
Thu 04 December 2025 |
45.02 (-1.9%) |
45.62 |
44.93 - 45.95 |
0.7714 times |
Wed 03 December 2025 |
45.89 (-1.01%) |
46.47 |
45.78 - 46.74 |
0.7682 times |
Tue 02 December 2025 |
46.36 (-1.88%) |
47.45 |
46.35 - 47.62 |
0.7129 times |
Mon 01 December 2025 |
47.25 (-1.73%) |
47.89 |
46.94 - 48.19 |
0.8874 times |
Fri 28 November 2025 |
48.08 (0.42%) |
47.98 |
47.75 - 48.19 |
0.488 times |
Wed 26 November 2025 |
47.88 (0%) |
47.76 |
47.62 - 48.00 |
0.9453 times |
Tue 25 November 2025 |
47.88 (-0.85%) |
48.45 |
47.83 - 48.79 |
0.8421 times |
Mon 24 November 2025 |
48.29 (-1.11%) |
48.59 |
48.06 - 48.83 |
1.1096 times |
Fri 21 November 2025 |
48.83 (1.64%) |
48.38 |
48.08 - 49.32 |
1.6959 times |
Thu 20 November 2025 |
48.04 (4.1%) |
45.50 |
45.44 - 48.26 |
1.7792 times |
Wed 19 November 2025 |
46.15 (-0.5%) |
46.17 |
46.00 - 46.61 |
1.5213 times |
Weekly price and charts NewjerseyResources Strong weekly Stock price targets for NewjerseyResources NJR are 43.35 and 46.61 | Weekly Target 1 | 42.79 | | Weekly Target 2 | 43.9 | | Weekly Target 3 | 46.046666666667 | | Weekly Target 4 | 47.16 | | Weekly Target 5 | 49.31 |
Weekly price and volumes for Newjersey Resources
| Date |
Closing |
Open |
Range |
Volume |
Thu 04 December 2025 |
45.02 (-6.36%) |
47.89 |
44.93 - 48.19 |
0.8852 times |
Fri 28 November 2025 |
48.08 (-1.54%) |
48.59 |
47.62 - 48.83 |
0.9543 times |
Fri 21 November 2025 |
48.83 (4.74%) |
46.92 |
45.44 - 49.32 |
1.9193 times |
Fri 14 November 2025 |
46.62 (1.9%) |
45.56 |
45.21 - 46.89 |
1.0422 times |
Fri 07 November 2025 |
45.75 (3.27%) |
44.32 |
43.72 - 45.94 |
0.8567 times |
Fri 31 October 2025 |
44.30 (0%) |
44.41 |
44.02 - 44.50 |
0.2915 times |
Fri 31 October 2025 |
44.30 (-3.8%) |
45.89 |
44.02 - 45.95 |
1.3837 times |
Fri 24 October 2025 |
46.05 (-1.39%) |
46.85 |
45.32 - 47.12 |
1.2192 times |
Fri 17 October 2025 |
46.70 (0.32%) |
45.65 |
45.05 - 46.72 |
1.0758 times |
Tue 07 October 2025 |
46.55 (-0.92%) |
47.09 |
46.28 - 47.21 |
0.3721 times |
Fri 03 October 2025 |
46.98 (-1.67%) |
47.68 |
46.90 - 48.30 |
1.1931 times |

Monthly price and charts NewjerseyResources Strong monthly Stock price targets for NewjerseyResources NJR are 43.35 and 46.61 | Monthly Target 1 | 42.79 | | Monthly Target 2 | 43.9 | | Monthly Target 3 | 46.046666666667 | | Monthly Target 4 | 47.16 | | Monthly Target 5 | 49.31 |
Monthly price and volumes Newjersey Resources
| Date |
Closing |
Open |
Range |
Volume |
Thu 04 December 2025 |
45.02 (-6.36%) |
47.89 |
44.93 - 48.19 |
0.1702 times |
Fri 28 November 2025 |
48.08 (8.53%) |
44.32 |
43.72 - 49.32 |
0.9179 times |
Fri 31 October 2025 |
44.30 (-8%) |
48.17 |
44.02 - 48.22 |
0.9687 times |
Tue 30 September 2025 |
48.15 (1.82%) |
47.07 |
46.04 - 48.30 |
1.1055 times |
Fri 29 August 2025 |
47.29 (3.01%) |
46.16 |
45.51 - 48.01 |
1.1083 times |
Thu 31 July 2025 |
45.91 (2.43%) |
44.64 |
44.51 - 47.14 |
1.1425 times |
Mon 30 June 2025 |
44.82 (-2.33%) |
45.60 |
43.80 - 46.18 |
1.0813 times |
Fri 30 May 2025 |
45.89 (-6.23%) |
48.91 |
45.04 - 50.76 |
1.1355 times |
Wed 30 April 2025 |
48.94 (-0.24%) |
49.03 |
45.51 - 50.44 |
1.1326 times |
Mon 31 March 2025 |
49.06 (1.41%) |
48.24 |
47.01 - 50.05 |
1.2375 times |
Fri 28 February 2025 |
48.38 (0.9%) |
47.16 |
45.20 - 48.47 |
0.868 times |

DMA SMA EMA moving averages of Newjersey Resources NJR
DMA (daily moving average) of Newjersey Resources NJR
| DMA period | DMA value | | 5 day DMA | 46.52 | | 12 day DMA | 47.17 | | 20 day DMA | 46.73 | | 35 day DMA | 46.21 | | 50 day DMA | 46.43 | | 100 day DMA | 46.55 | | 150 day DMA | 46.38 | | 200 day DMA | 46.89 | EMA (exponential moving average) of Newjersey Resources NJR
| EMA period | EMA current | EMA prev | EMA prev2 | | 5 day EMA | 46.21 | 46.8 | 47.25 | | 12 day EMA | 46.68 | 46.98 | 47.18 | | 20 day EMA | 46.64 | 46.81 | 46.91 | | 35 day EMA | 46.65 | 46.75 | 46.8 | | 50 day EMA | 46.44 | 46.5 | 46.53 |
SMA (simple moving average) of Newjersey Resources NJR
| SMA period | SMA current | SMA prev | SMA prev2 | | 5 day SMA | 46.52 | 47.09 | 47.49 | | 12 day SMA | 47.17 | 47.3 | 47.36 | | 20 day SMA | 46.73 | 46.71 | 46.66 | | 35 day SMA | 46.21 | 46.25 | 46.24 | | 50 day SMA | 46.43 | 46.47 | 46.49 | | 100 day SMA | 46.55 | 46.56 | 46.56 | | 150 day SMA | 46.38 | 46.41 | 46.43 | | 200 day SMA | 46.89 | 46.9 | 46.9 |
|
|
