NaturalGrocers NGVC full analysis,charts,indicators,moving averages,SMA,DMA,EMA,ADX,MACD,RSINatural Grocers NGVC WideScreen charts, DMA,SMA,EMA technical analysis, forecast prediction, by indicators ADX,MACD,RSI,CCI NYSE stock exchange
operates under Consumer Services sector & deals in Food Chains
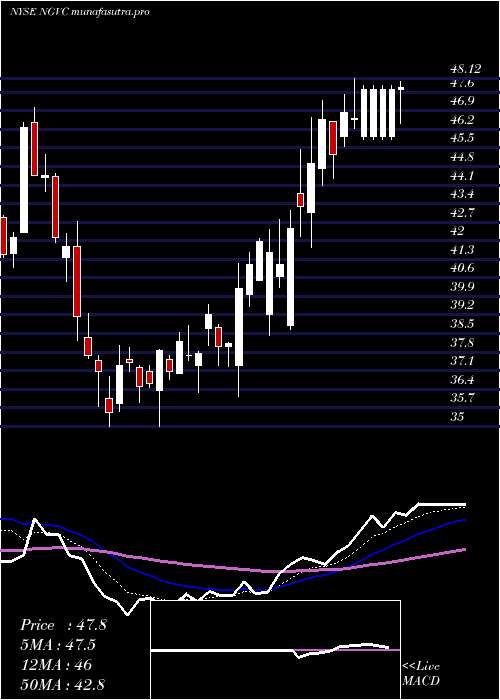
Daily price and charts and targets NaturalGrocers Strong Daily Stock price targets for NaturalGrocers NGVC are 24.26 and 25.91 | Daily Target 1 | 23.98 | | Daily Target 2 | 24.53 | | Daily Target 3 | 25.63 | | Daily Target 4 | 26.18 | | Daily Target 5 | 27.28 |
Daily price and volume Natural Grocers
| Date |
Closing |
Open |
Range |
Volume |
Fri 05 December 2025 |
25.08 (-5%) |
26.29 |
25.08 - 26.73 |
0.9148 times |
Thu 04 December 2025 |
26.40 (-2.87%) |
26.93 |
26.38 - 27.68 |
0.3257 times |
Wed 03 December 2025 |
27.18 (0.04%) |
27.02 |
27.02 - 27.88 |
0.8249 times |
Tue 02 December 2025 |
27.17 (-1.31%) |
27.87 |
26.80 - 28.43 |
0.8232 times |
Mon 01 December 2025 |
27.53 (-0.79%) |
27.59 |
27.15 - 28.20 |
1.0214 times |
Fri 28 November 2025 |
27.75 (-0.07%) |
27.75 |
27.52 - 28.22 |
0.7401 times |
Wed 26 November 2025 |
27.77 (-0.93%) |
28.21 |
27.69 - 28.53 |
0.8235 times |
Tue 25 November 2025 |
28.03 (-0.18%) |
28.43 |
27.77 - 29.47 |
1.2105 times |
Mon 24 November 2025 |
28.08 (-2.57%) |
29.01 |
27.92 - 29.43 |
1.5095 times |
Fri 21 November 2025 |
28.82 (-5.04%) |
29.97 |
26.75 - 31.69 |
1.8064 times |
Thu 20 November 2025 |
30.35 (-3.22%) |
31.46 |
29.98 - 32.22 |
1.0652 times |
Weekly price and charts NaturalGrocers Strong weekly Stock price targets for NaturalGrocers NGVC are 23.41 and 26.76 | Weekly Target 1 | 22.85 | | Weekly Target 2 | 23.96 | | Weekly Target 3 | 26.196666666667 | | Weekly Target 4 | 27.31 | | Weekly Target 5 | 29.55 |
Weekly price and volumes for Natural Grocers
| Date |
Closing |
Open |
Range |
Volume |
Fri 05 December 2025 |
25.08 (-9.62%) |
27.59 |
25.08 - 28.43 |
1.2636 times |
Fri 28 November 2025 |
27.75 (-3.71%) |
29.01 |
27.52 - 29.47 |
1.3843 times |
Fri 21 November 2025 |
28.82 (-11.02%) |
32.18 |
26.75 - 32.65 |
1.4863 times |
Fri 14 November 2025 |
32.39 (2.76%) |
31.51 |
31.16 - 32.96 |
0.8713 times |
Fri 07 November 2025 |
31.52 (-1.78%) |
33.18 |
30.55 - 33.78 |
1.1137 times |
Fri 31 October 2025 |
32.09 (0%) |
35.93 |
31.84 - 35.93 |
0.4101 times |
Fri 31 October 2025 |
32.09 (-20.77%) |
40.40 |
31.84 - 40.42 |
1.5003 times |
Fri 24 October 2025 |
40.50 (4.22%) |
39.16 |
38.36 - 41.07 |
0.7574 times |
Fri 17 October 2025 |
38.86 (-0.59%) |
37.09 |
37.09 - 40.88 |
0.7788 times |
Tue 07 October 2025 |
39.09 (-2.76%) |
40.06 |
37.31 - 40.11 |
0.4342 times |
Fri 03 October 2025 |
40.20 (6.89%) |
37.70 |
37.25 - 41.14 |
1.0259 times |
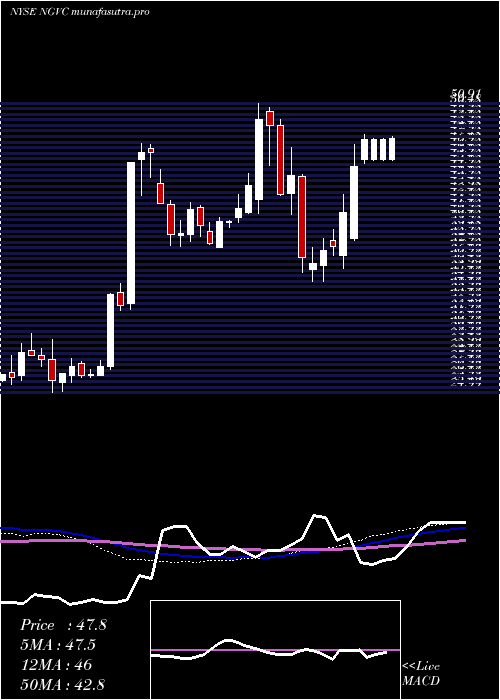
Monthly price and charts NaturalGrocers Strong monthly Stock price targets for NaturalGrocers NGVC are 23.41 and 26.76 | Monthly Target 1 | 22.85 | | Monthly Target 2 | 23.96 | | Monthly Target 3 | 26.196666666667 | | Monthly Target 4 | 27.31 | | Monthly Target 5 | 29.55 |
Monthly price and volumes Natural Grocers
| Date |
Closing |
Open |
Range |
Volume |
Fri 05 December 2025 |
25.08 (-9.62%) |
27.59 |
25.08 - 28.43 |
0.3051 times |
Fri 28 November 2025 |
27.75 (-13.52%) |
33.18 |
26.75 - 33.78 |
1.1723 times |
Fri 31 October 2025 |
32.09 (-19.78%) |
39.76 |
31.84 - 41.14 |
1.0513 times |
Tue 30 September 2025 |
40.00 (4.03%) |
38.08 |
35.15 - 40.18 |
1.2644 times |
Fri 29 August 2025 |
38.45 (1.48%) |
38.22 |
35.71 - 45.98 |
1.2953 times |
Thu 31 July 2025 |
37.89 (-3.46%) |
39.10 |
36.84 - 40.98 |
1.0515 times |
Mon 30 June 2025 |
39.25 (-19.62%) |
48.60 |
35.87 - 49.17 |
1.3913 times |
Fri 30 May 2025 |
48.83 (-2.65%) |
49.66 |
44.68 - 61.22 |
1.0827 times |
Wed 30 April 2025 |
50.16 (24.78%) |
39.98 |
38.43 - 50.64 |
0.719 times |
Mon 31 March 2025 |
40.20 (-9.54%) |
44.43 |
35.00 - 44.53 |
0.6671 times |
Fri 28 February 2025 |
44.44 (2.07%) |
42.32 |
41.01 - 50.91 |
0.9224 times |

DMA SMA EMA moving averages of Natural Grocers NGVC
DMA (daily moving average) of Natural Grocers NGVC
| DMA period | DMA value | | 5 day DMA | 26.67 | | 12 day DMA | 27.96 | | 20 day DMA | 29.5 | | 35 day DMA | 32.68 | | 50 day DMA | 34.52 | | 100 day DMA | 36.58 | | 150 day DMA | 39.58 | | 200 day DMA | 40.39 | EMA (exponential moving average) of Natural Grocers NGVC
| EMA period | EMA current | EMA prev | EMA prev2 | | 5 day EMA | 26.49 | 27.19 | 27.58 | | 12 day EMA | 27.91 | 28.43 | 28.8 | | 20 day EMA | 29.34 | 29.79 | 30.15 | | 35 day EMA | 31.63 | 32.02 | 32.35 | | 50 day EMA | 33.9 | 34.26 | 34.58 |
SMA (simple moving average) of Natural Grocers NGVC
| SMA period | SMA current | SMA prev | SMA prev2 | | 5 day SMA | 26.67 | 27.21 | 27.48 | | 12 day SMA | 27.96 | 28.46 | 28.9 | | 20 day SMA | 29.5 | 29.81 | 30.11 | | 35 day SMA | 32.68 | 33.08 | 33.49 | | 50 day SMA | 34.52 | 34.74 | 34.93 | | 100 day SMA | 36.58 | 36.72 | 36.85 | | 150 day SMA | 39.58 | 39.74 | 39.89 | | 200 day SMA | 40.39 | 40.52 | 40.63 |
|
|
