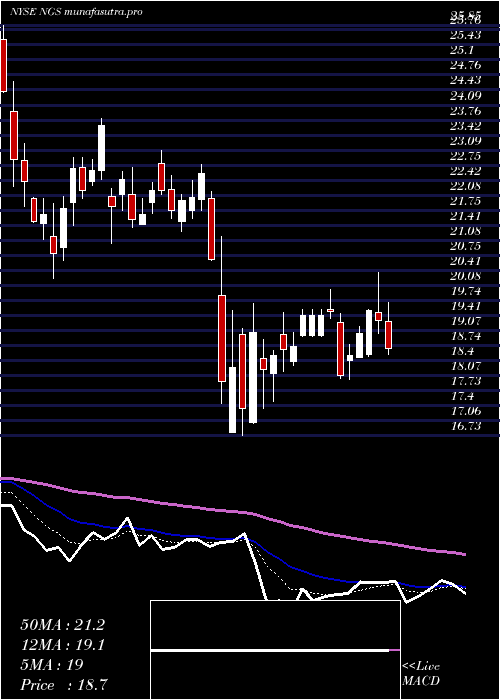
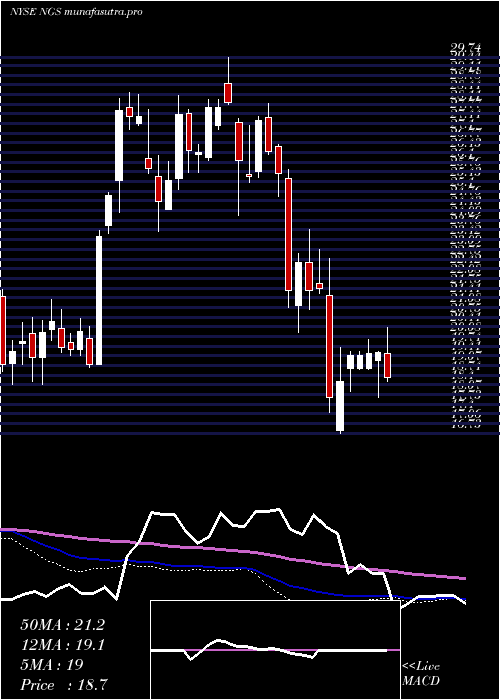
NaturalGas NGS full analysis,charts,indicators,moving averages,SMA,DMA,EMA,ADX,MACD,RSINatural Gas NGS WideScreen charts, DMA,SMA,EMA technical analysis, forecast prediction, by indicators ADX,MACD,RSI,CCI NYSE stock exchange
operates under Energy sector & deals in Oilfield Services Equipment
Daily price and charts and targets NaturalGas Strong Daily Stock price targets for NaturalGas NGS are 26.47 and 27.51 | Daily Target 1 | 26.21 | | Daily Target 2 | 26.73 | | Daily Target 3 | 27.25 | | Daily Target 4 | 27.77 | | Daily Target 5 | 28.29 |
Daily price and volume Natural Gas
| Date |
Closing |
Open |
Range |
Volume |
Tue 21 October 2025 |
27.25 (0.11%) |
27.46 |
26.73 - 27.77 |
1.1266 times |
Mon 20 October 2025 |
27.22 (5.3%) |
26.06 |
26.05 - 27.35 |
1.1311 times |
Fri 17 October 2025 |
25.85 (-0.92%) |
26.03 |
25.72 - 26.24 |
0.8135 times |
Thu 16 October 2025 |
26.09 (-1.25%) |
26.37 |
25.71 - 26.63 |
1.0808 times |
Wed 15 October 2025 |
26.42 (0.69%) |
26.26 |
25.73 - 26.76 |
0.7244 times |
Tue 14 October 2025 |
26.24 (0.23%) |
25.80 |
25.80 - 26.55 |
0.9369 times |
Mon 13 October 2025 |
26.18 (-3.75%) |
25.97 |
25.53 - 26.32 |
0.8843 times |
Tue 07 October 2025 |
27.20 (0.07%) |
27.11 |
26.57 - 27.24 |
0.9552 times |
Mon 06 October 2025 |
27.18 (0.33%) |
27.13 |
26.75 - 27.36 |
0.5603 times |
Fri 03 October 2025 |
27.09 (1.31%) |
27.08 |
26.55 - 27.52 |
1.7869 times |
Thu 02 October 2025 |
26.74 (-4.77%) |
28.08 |
26.50 - 28.08 |
0.8488 times |
Weekly price and charts NaturalGas Strong weekly Stock price targets for NaturalGas NGS are 26.65 and 28.37 | Weekly Target 1 | 25.3 | | Weekly Target 2 | 26.28 | | Weekly Target 3 | 27.023333333333 | | Weekly Target 4 | 28 | | Weekly Target 5 | 28.74 |
Weekly price and volumes for Natural Gas
| Date |
Closing |
Open |
Range |
Volume |
Tue 21 October 2025 |
27.25 (5.42%) |
26.06 |
26.05 - 27.77 |
0.4557 times |
Fri 17 October 2025 |
25.85 (-4.96%) |
25.97 |
25.53 - 26.76 |
0.8962 times |
Tue 07 October 2025 |
27.20 (0.41%) |
27.13 |
26.57 - 27.36 |
0.3059 times |
Fri 03 October 2025 |
27.09 (-5.87%) |
28.78 |
26.50 - 28.84 |
1.8263 times |
Fri 26 September 2025 |
28.78 (6.36%) |
27.00 |
26.55 - 28.92 |
1.4875 times |
Fri 19 September 2025 |
27.06 (1.42%) |
26.87 |
26.51 - 27.64 |
1.6166 times |
Fri 12 September 2025 |
26.68 (0.68%) |
26.59 |
25.93 - 26.89 |
1.0466 times |
Fri 05 September 2025 |
26.50 (1.3%) |
25.90 |
25.83 - 27.14 |
0.9861 times |
Fri 29 August 2025 |
26.16 (0%) |
26.54 |
25.98 - 26.54 |
0.1596 times |
Fri 29 August 2025 |
26.16 (-1.95%) |
26.50 |
25.05 - 26.64 |
1.2195 times |
Fri 22 August 2025 |
26.68 (9.25%) |
24.36 |
24.26 - 26.88 |
1.1605 times |
Monthly price and charts NaturalGas Strong monthly Stock price targets for NaturalGas NGS are 24.94 and 27.85 | Monthly Target 1 | 24.16 | | Monthly Target 2 | 25.71 | | Monthly Target 3 | 27.073333333333 | | Monthly Target 4 | 28.62 | | Monthly Target 5 | 29.98 |
Monthly price and volumes Natural Gas
| Date |
Closing |
Open |
Range |
Volume |
Tue 21 October 2025 |
27.25 (-2.64%) |
27.71 |
25.53 - 28.44 |
0.3733 times |
Tue 30 September 2025 |
27.99 (7%) |
25.90 |
25.83 - 28.92 |
0.9656 times |
Fri 29 August 2025 |
26.16 (8.59%) |
23.88 |
22.72 - 26.88 |
0.902 times |
Thu 31 July 2025 |
24.09 (-6.66%) |
25.80 |
23.62 - 26.25 |
0.7844 times |
Mon 30 June 2025 |
25.81 (7.68%) |
24.64 |
23.93 - 27.84 |
1.2122 times |
Fri 30 May 2025 |
23.97 (33.39%) |
17.89 |
17.89 - 26.50 |
1.0805 times |
Wed 30 April 2025 |
17.97 (-18.21%) |
21.74 |
16.73 - 22.76 |
1.1543 times |
Mon 31 March 2025 |
21.97 (-14.55%) |
25.55 |
20.22 - 25.85 |
1.1764 times |
Fri 28 February 2025 |
25.71 (-1.76%) |
25.68 |
24.91 - 28.13 |
0.7319 times |
Fri 31 January 2025 |
26.17 (-2.35%) |
27.00 |
24.25 - 29.74 |
1.6196 times |
Tue 31 December 2024 |
26.80 (-3.18%) |
26.24 |
23.70 - 27.95 |
0.843 times |

DMA SMA EMA moving averages of Natural Gas NGS
DMA (daily moving average) of Natural Gas NGS
| DMA period | DMA value | | 5 day DMA | 26.57 | | 12 day DMA | 26.8 | | 20 day DMA | 27.3 | | 35 day DMA | 27.01 | | 50 day DMA | 26.53 | | 100 day DMA | 25.73 | | 150 day DMA | 24.11 | | 200 day DMA | 24.66 | EMA (exponential moving average) of Natural Gas NGS
| EMA period | EMA current | EMA prev | EMA prev2 | | 5 day EMA | 26.8 | 26.57 | 26.24 | | 12 day EMA | 26.85 | 26.78 | 26.7 | | 20 day EMA | 26.92 | 26.89 | 26.85 | | 35 day EMA | 26.66 | 26.63 | 26.6 | | 50 day EMA | 26.33 | 26.29 | 26.25 |
SMA (simple moving average) of Natural Gas NGS
| SMA period | SMA current | SMA prev | SMA prev2 | | 5 day SMA | 26.57 | 26.36 | 26.16 | | 12 day SMA | 26.8 | 26.86 | 26.96 | | 20 day SMA | 27.3 | 27.3 | 27.28 | | 35 day SMA | 27.01 | 26.99 | 26.95 | | 50 day SMA | 26.53 | 26.46 | 26.4 | | 100 day SMA | 25.73 | 25.69 | 25.66 | | 150 day SMA | 24.11 | 24.07 | 24.03 | | 200 day SMA | 24.66 | 24.65 | 24.64 |
|
|
