NglEnergy NGL-C full analysis,charts,indicators,moving averages,SMA,DMA,EMA,ADX,MACD,RSINgl Energy NGL-C WideScreen charts, DMA,SMA,EMA technical analysis, forecast prediction, by indicators ADX,MACD,RSI,CCI NYSE stock exchange
Daily price and charts and targets NglEnergy Strong Daily Stock price targets for NglEnergy NGL-C are 24.12 and 24.29 | Daily Target 1 | 23.99 | | Daily Target 2 | 24.07 | | Daily Target 3 | 24.156666666667 | | Daily Target 4 | 24.24 | | Daily Target 5 | 24.33 |
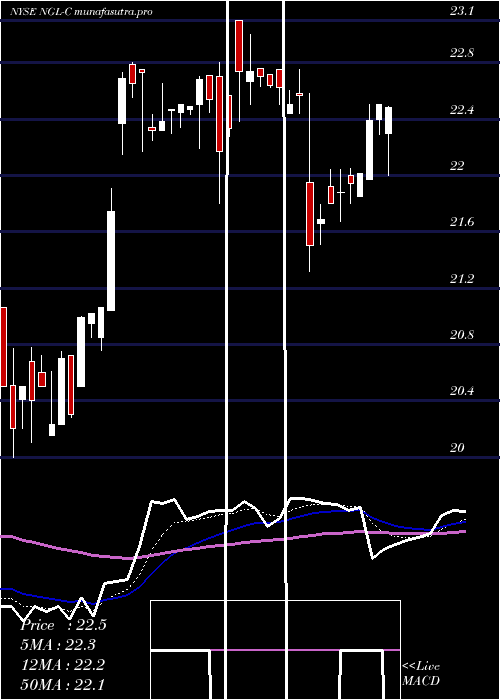
Daily price and volume Ngl Energy
| Date |
Closing |
Open |
Range |
Volume |
Fri 05 December 2025 |
24.16 (0.12%) |
24.14 |
24.07 - 24.24 |
2.6316 times |
Thu 04 December 2025 |
24.13 (-0.58%) |
24.13 |
24.13 - 24.13 |
0.1754 times |
Wed 03 December 2025 |
24.27 (0.04%) |
24.09 |
24.09 - 24.27 |
1.2281 times |
Tue 02 December 2025 |
24.26 (0.54%) |
24.03 |
24.03 - 24.26 |
0.2339 times |
Mon 01 December 2025 |
24.13 (-0.29%) |
24.20 |
24.06 - 24.23 |
1.462 times |
Fri 28 November 2025 |
24.20 (0.83%) |
24.18 |
24.09 - 24.20 |
0.7602 times |
Wed 26 November 2025 |
24.00 (0.38%) |
23.90 |
23.89 - 24.00 |
2.6316 times |
Tue 25 November 2025 |
23.91 (0.25%) |
24.00 |
23.91 - 24.00 |
0.2924 times |
Mon 24 November 2025 |
23.85 (0.21%) |
23.85 |
23.85 - 23.85 |
0.0585 times |
Thu 20 November 2025 |
23.80 (0.13%) |
23.80 |
23.80 - 23.85 |
0.5263 times |
Wed 19 November 2025 |
23.77 (0.08%) |
23.75 |
23.70 - 23.79 |
0.8187 times |
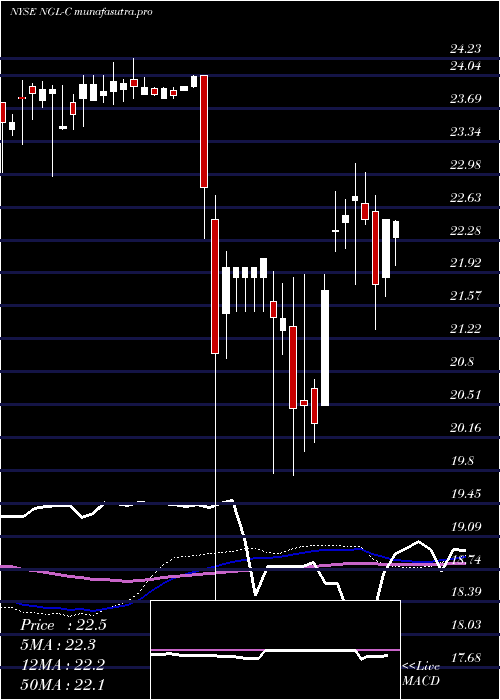
Weekly price and charts NglEnergy Strong weekly Stock price targets for NglEnergy NGL-C are 23.98 and 24.22 | Weekly Target 1 | 23.91 | | Weekly Target 2 | 24.04 | | Weekly Target 3 | 24.153333333333 | | Weekly Target 4 | 24.28 | | Weekly Target 5 | 24.39 |
Weekly price and volumes for Ngl Energy
| Date |
Closing |
Open |
Range |
Volume |
Fri 05 December 2025 |
24.16 (-0.17%) |
24.20 |
24.03 - 24.27 |
0.5865 times |
Fri 28 November 2025 |
24.20 (1.68%) |
23.85 |
23.85 - 24.20 |
0.383 times |
Thu 20 November 2025 |
23.80 (-1.45%) |
24.20 |
23.65 - 24.22 |
0.5326 times |
Fri 14 November 2025 |
24.15 (-0.21%) |
24.14 |
23.83 - 24.29 |
0.5506 times |
Fri 07 November 2025 |
24.20 (5.91%) |
22.51 |
22.51 - 24.25 |
1.6936 times |
Fri 31 October 2025 |
22.85 (0%) |
23.24 |
22.50 - 23.24 |
0.9994 times |
Fri 31 October 2025 |
22.85 (-0.78%) |
23.00 |
22.50 - 23.24 |
2.1305 times |
Fri 24 October 2025 |
23.03 (0.13%) |
23.00 |
22.75 - 23.53 |
0.9635 times |
Fri 17 October 2025 |
23.00 (-0.3%) |
23.05 |
22.85 - 23.41 |
1.0772 times |
Fri 10 October 2025 |
23.07 (-2.58%) |
23.80 |
23.05 - 23.80 |
1.0832 times |
Fri 03 October 2025 |
23.68 (-2.27%) |
24.40 |
23.33 - 24.46 |
1.2926 times |
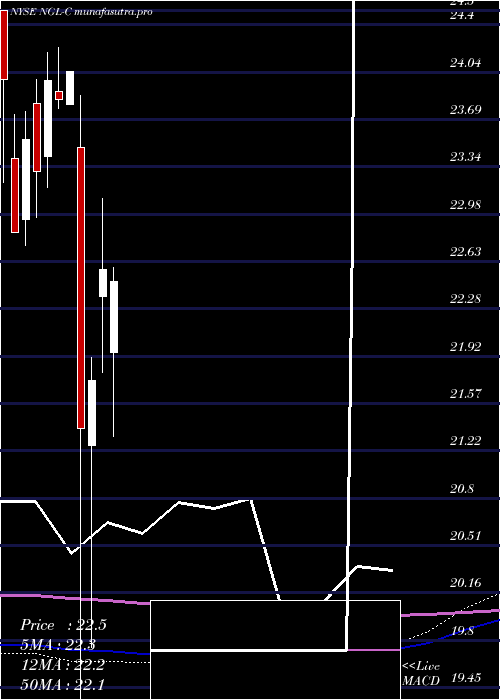
Monthly price and charts NglEnergy Strong monthly Stock price targets for NglEnergy NGL-C are 23.98 and 24.22 | Monthly Target 1 | 23.91 | | Monthly Target 2 | 24.04 | | Monthly Target 3 | 24.153333333333 | | Monthly Target 4 | 24.28 | | Monthly Target 5 | 24.39 |
Monthly price and volumes Ngl Energy
| Date |
Closing |
Open |
Range |
Volume |
Fri 05 December 2025 |
24.16 (-0.17%) |
24.20 |
24.03 - 24.27 |
0.0752 times |
Fri 28 November 2025 |
24.20 (5.91%) |
22.51 |
22.51 - 24.29 |
0.4049 times |
Fri 31 October 2025 |
22.85 (-6.39%) |
24.23 |
22.50 - 24.23 |
0.8474 times |
Tue 30 September 2025 |
24.41 (4.54%) |
23.35 |
23.04 - 24.46 |
0.987 times |
Fri 29 August 2025 |
23.35 (4.8%) |
22.63 |
21.20 - 23.85 |
0.8099 times |
Thu 31 July 2025 |
22.28 (-1.28%) |
21.95 |
21.32 - 22.94 |
0.7893 times |
Mon 30 June 2025 |
22.57 (3.82%) |
22.37 |
21.80 - 23.10 |
0.6538 times |
Fri 30 May 2025 |
21.74 (1.68%) |
21.26 |
19.75 - 21.91 |
1.0626 times |
Wed 30 April 2025 |
21.38 (-11.1%) |
23.48 |
17.68 - 23.87 |
3.694 times |
Mon 31 March 2025 |
24.05 (0.88%) |
23.80 |
23.80 - 24.05 |
0.676 times |
Fri 28 February 2025 |
23.84 (-0.58%) |
23.90 |
23.77 - 24.23 |
0.7293 times |
DMA SMA EMA moving averages of Ngl Energy NGL-C
DMA (daily moving average) of Ngl Energy NGL-C
| DMA period | DMA value | | 5 day DMA | 24.19 | | 12 day DMA | 24.02 | | 20 day DMA | 24.05 | | 35 day DMA | 23.63 | | 50 day DMA | 23.66 | | 100 day DMA | 23.33 | | 150 day DMA | 22.77 | | 200 day DMA | 22.83 | EMA (exponential moving average) of Ngl Energy NGL-C
| EMA period | EMA current | EMA prev | EMA prev2 | | 5 day EMA | 24.16 | 24.16 | 24.17 | | 12 day EMA | 24.07 | 24.05 | 24.03 | | 20 day EMA | 23.97 | 23.95 | 23.93 | | 35 day EMA | 23.89 | 23.87 | 23.85 | | 50 day EMA | 23.74 | 23.72 | 23.7 |
SMA (simple moving average) of Ngl Energy NGL-C
| SMA period | SMA current | SMA prev | SMA prev2 | | 5 day SMA | 24.19 | 24.2 | 24.17 | | 12 day SMA | 24.02 | 23.99 | 23.99 | | 20 day SMA | 24.05 | 24.04 | 23.97 | | 35 day SMA | 23.63 | 23.6 | 23.57 | | 50 day SMA | 23.66 | 23.65 | 23.64 | | 100 day SMA | 23.33 | 23.31 | 23.3 | | 150 day SMA | 22.77 | 22.75 | 22.73 | | 200 day SMA | 22.83 | 22.83 | 22.82 |
|
|
