NglEnergy NGL-B full analysis,charts,indicators,moving averages,SMA,DMA,EMA,ADX,MACD,RSINgl Energy NGL-B WideScreen charts, DMA,SMA,EMA technical analysis, forecast prediction, by indicators ADX,MACD,RSI,CCI NYSE stock exchange
Daily price and charts and targets NglEnergy Strong Daily Stock price targets for NglEnergy NGL-B are 22.12 and 22.67 | Daily Target 1 | 22.03 | | Daily Target 2 | 22.21 | | Daily Target 3 | 22.576666666667 | | Daily Target 4 | 22.76 | | Daily Target 5 | 23.13 |
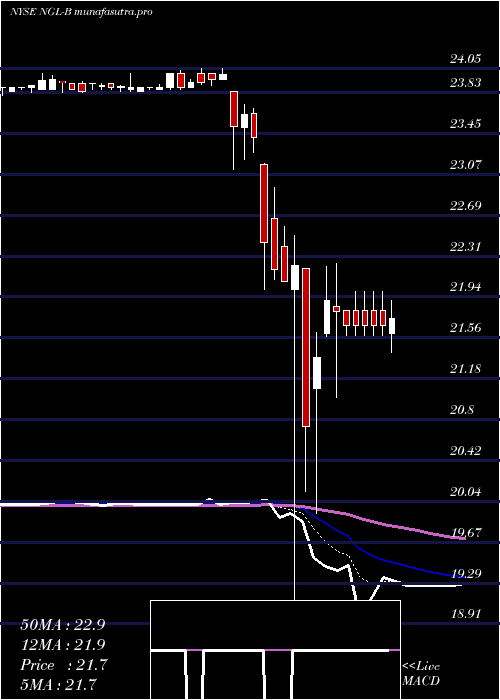
Daily price and volume Ngl Energy
| Date |
Closing |
Open |
Range |
Volume |
Mon 20 October 2025 |
22.40 (-0.4%) |
22.52 |
22.39 - 22.94 |
0.7259 times |
Fri 17 October 2025 |
22.49 (0.31%) |
22.34 |
22.27 - 22.52 |
0.1876 times |
Thu 16 October 2025 |
22.42 (0%) |
22.52 |
22.35 - 22.52 |
0.2719 times |
Wed 15 October 2025 |
22.42 (0.76%) |
22.40 |
22.23 - 22.48 |
0.5247 times |
Tue 14 October 2025 |
22.25 (-2.15%) |
22.68 |
22.12 - 22.68 |
4.72 times |
Mon 13 October 2025 |
22.74 (1.34%) |
23.01 |
22.62 - 23.15 |
0.7477 times |
Fri 10 October 2025 |
22.44 (-2.86%) |
23.44 |
22.26 - 23.44 |
2.031 times |
Thu 09 October 2025 |
23.10 (0.22%) |
23.08 |
23.05 - 23.31 |
0.1767 times |
Wed 08 October 2025 |
23.05 (-0.17%) |
23.48 |
23.05 - 23.53 |
0.193 times |
Tue 07 October 2025 |
23.09 (-1.03%) |
23.47 |
23.08 - 23.47 |
0.4214 times |
Mon 06 October 2025 |
23.33 (-0.09%) |
23.44 |
23.15 - 23.44 |
0.242 times |
Weekly price and charts NglEnergy Strong weekly Stock price targets for NglEnergy NGL-B are 22.12 and 22.67 | Weekly Target 1 | 22.03 | | Weekly Target 2 | 22.21 | | Weekly Target 3 | 22.576666666667 | | Weekly Target 4 | 22.76 | | Weekly Target 5 | 23.13 |
Weekly price and volumes for Ngl Energy
| Date |
Closing |
Open |
Range |
Volume |
Mon 20 October 2025 |
22.40 (-0.4%) |
22.52 |
22.39 - 22.94 |
0.1315 times |
Fri 17 October 2025 |
22.49 (0.22%) |
23.01 |
22.12 - 23.15 |
1.1688 times |
Fri 10 October 2025 |
22.44 (-3.9%) |
23.44 |
22.26 - 23.53 |
0.5551 times |
Fri 03 October 2025 |
23.35 (-2.34%) |
23.91 |
22.78 - 23.93 |
0.7053 times |
Fri 26 September 2025 |
23.91 (0.13%) |
23.90 |
23.25 - 24.00 |
1.3643 times |
Fri 19 September 2025 |
23.88 (0.08%) |
23.83 |
23.31 - 24.00 |
1.7662 times |
Fri 12 September 2025 |
23.86 (1.06%) |
23.62 |
23.37 - 24.00 |
0.4911 times |
Fri 05 September 2025 |
23.61 (3.19%) |
23.45 |
23.02 - 23.64 |
0.3655 times |
Fri 29 August 2025 |
22.88 (0%) |
23.75 |
22.79 - 23.75 |
1.5732 times |
Fri 29 August 2025 |
22.88 (0.35%) |
22.70 |
22.70 - 23.75 |
1.879 times |
Fri 22 August 2025 |
22.80 (2.38%) |
22.21 |
22.20 - 22.83 |
0.2413 times |

Monthly price and charts NglEnergy Strong monthly Stock price targets for NglEnergy NGL-B are 21.56 and 22.97 | Monthly Target 1 | 21.27 | | Monthly Target 2 | 21.84 | | Monthly Target 3 | 22.683333333333 | | Monthly Target 4 | 23.25 | | Monthly Target 5 | 24.09 |
Monthly price and volumes Ngl Energy
| Date |
Closing |
Open |
Range |
Volume |
Mon 20 October 2025 |
22.40 (-3.82%) |
23.10 |
22.12 - 23.53 |
0.5918 times |
Tue 30 September 2025 |
23.29 (1.79%) |
23.45 |
23.02 - 24.00 |
1.3099 times |
Fri 29 August 2025 |
22.88 (2.83%) |
22.45 |
20.48 - 23.75 |
2.0033 times |
Thu 31 July 2025 |
22.25 (1.37%) |
21.40 |
20.33 - 22.50 |
0.5705 times |
Mon 30 June 2025 |
21.95 (-3.73%) |
22.76 |
21.95 - 22.99 |
0.8139 times |
Fri 30 May 2025 |
22.80 (7.8%) |
21.15 |
19.79 - 22.80 |
1.4135 times |
Wed 30 April 2025 |
21.15 (-11.84%) |
23.84 |
18.91 - 23.84 |
1.1641 times |
Mon 31 March 2025 |
23.99 (0.42%) |
23.85 |
23.83 - 24.05 |
1.1382 times |
Fri 28 February 2025 |
23.89 (0.84%) |
23.69 |
23.69 - 24.14 |
0.5401 times |
Fri 31 January 2025 |
23.69 (-1.29%) |
23.90 |
23.23 - 24.25 |
0.4547 times |
Tue 31 December 2024 |
24.00 (2.13%) |
23.70 |
22.75 - 24.00 |
0.3977 times |

DMA SMA EMA moving averages of Ngl Energy NGL-B
DMA (daily moving average) of Ngl Energy NGL-B
| DMA period | DMA value | | 5 day DMA | 22.4 | | 12 day DMA | 22.76 | | 20 day DMA | 23.12 | | 35 day DMA | 23.37 | | 50 day DMA | 23.14 | | 100 day DMA | 22.59 | | 150 day DMA | 22.3 | | 200 day DMA | 22.7 | EMA (exponential moving average) of Ngl Energy NGL-B
| EMA period | EMA current | EMA prev | EMA prev2 | | 5 day EMA | 22.48 | 22.52 | 22.53 | | 12 day EMA | 22.73 | 22.79 | 22.84 | | 20 day EMA | 22.92 | 22.98 | 23.03 | | 35 day EMA | 22.93 | 22.96 | 22.99 | | 50 day EMA | 22.92 | 22.94 | 22.96 |
SMA (simple moving average) of Ngl Energy NGL-B
| SMA period | SMA current | SMA prev | SMA prev2 | | 5 day SMA | 22.4 | 22.46 | 22.45 | | 12 day SMA | 22.76 | 22.82 | 22.89 | | 20 day SMA | 23.12 | 23.19 | 23.26 | | 35 day SMA | 23.37 | 23.38 | 23.41 | | 50 day SMA | 23.14 | 23.12 | 23.08 | | 100 day SMA | 22.59 | 22.57 | 22.55 | | 150 day SMA | 22.3 | 22.31 | 22.32 | | 200 day SMA | 22.7 | 22.71 | 22.72 |
|
|
