NglEnergy NGL full analysis,charts,indicators,moving averages,SMA,DMA,EMA,ADX,MACD,RSINgl Energy NGL WideScreen charts, DMA,SMA,EMA technical analysis, forecast prediction, by indicators ADX,MACD,RSI,CCI NYSE stock exchange
operates under Energy sector & deals in Oil Refining Marketing
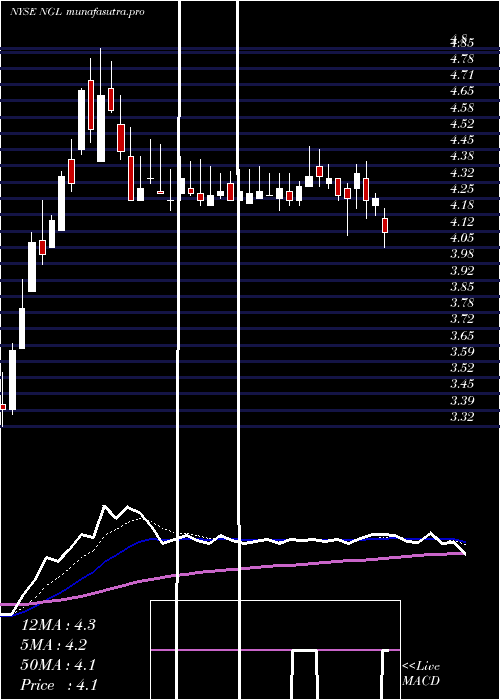
Daily price and charts and targets NglEnergy Strong Daily Stock price targets for NglEnergy NGL are 6.17 and 6.48 | Daily Target 1 | 5.92 | | Daily Target 2 | 6.1 | | Daily Target 3 | 6.2266666666667 | | Daily Target 4 | 6.41 | | Daily Target 5 | 6.54 |
Daily price and volume Ngl Energy
| Date |
Closing |
Open |
Range |
Volume |
Mon 20 October 2025 |
6.29 (4.14%) |
6.08 |
6.04 - 6.35 |
0.4904 times |
Fri 17 October 2025 |
6.04 (-1.95%) |
6.14 |
6.04 - 6.22 |
1.1279 times |
Thu 16 October 2025 |
6.16 (-1.75%) |
6.34 |
6.16 - 6.38 |
0.7621 times |
Wed 15 October 2025 |
6.27 (1.13%) |
6.27 |
6.19 - 6.39 |
0.5049 times |
Tue 14 October 2025 |
6.20 (0.32%) |
6.08 |
6.04 - 6.24 |
1.4207 times |
Mon 13 October 2025 |
6.18 (1.15%) |
6.20 |
6.10 - 6.34 |
0.6752 times |
Tue 07 October 2025 |
6.11 (0.49%) |
6.06 |
6.04 - 6.15 |
0.5058 times |
Mon 06 October 2025 |
6.08 (-0.33%) |
6.10 |
5.97 - 6.20 |
0.4087 times |
Fri 03 October 2025 |
6.10 (4.1%) |
5.89 |
5.88 - 6.13 |
0.7102 times |
Thu 02 October 2025 |
5.86 (-3.3%) |
5.98 |
5.80 - 6.03 |
3.3942 times |
Wed 01 October 2025 |
6.06 (1%) |
6.00 |
5.96 - 6.15 |
0.4758 times |
Weekly price and charts NglEnergy Strong weekly Stock price targets for NglEnergy NGL are 6.17 and 6.48 | Weekly Target 1 | 5.92 | | Weekly Target 2 | 6.1 | | Weekly Target 3 | 6.2266666666667 | | Weekly Target 4 | 6.41 | | Weekly Target 5 | 6.54 |
Weekly price and volumes for Ngl Energy
| Date |
Closing |
Open |
Range |
Volume |
Mon 20 October 2025 |
6.29 (4.14%) |
6.08 |
6.04 - 6.35 |
0.0847 times |
Fri 17 October 2025 |
6.04 (-1.15%) |
6.20 |
6.04 - 6.39 |
0.776 times |
Tue 07 October 2025 |
6.11 (0.16%) |
6.10 |
5.97 - 6.20 |
0.158 times |
Fri 03 October 2025 |
6.10 (-1.93%) |
6.22 |
5.80 - 6.22 |
1.0479 times |
Fri 26 September 2025 |
6.22 (-6.18%) |
6.62 |
6.14 - 6.63 |
0.6163 times |
Fri 19 September 2025 |
6.63 (14.51%) |
5.75 |
5.72 - 7.15 |
2.4112 times |
Fri 12 September 2025 |
5.79 (0.7%) |
5.79 |
5.71 - 5.99 |
1.3228 times |
Fri 05 September 2025 |
5.75 (6.28%) |
5.36 |
5.36 - 5.89 |
1.3611 times |
Fri 29 August 2025 |
5.41 (0%) |
5.32 |
5.32 - 5.48 |
0.4528 times |
Fri 29 August 2025 |
5.41 (10.41%) |
4.89 |
4.89 - 5.50 |
1.769 times |
Fri 22 August 2025 |
4.90 (-0.81%) |
4.93 |
4.88 - 5.14 |
3.0594 times |
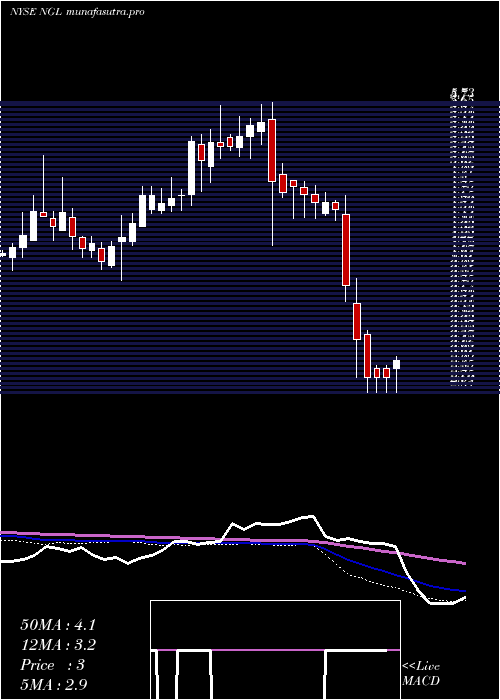
Monthly price and charts NglEnergy Strong monthly Stock price targets for NglEnergy NGL are 6.05 and 6.64 | Monthly Target 1 | 5.57 | | Monthly Target 2 | 5.93 | | Monthly Target 3 | 6.16 | | Monthly Target 4 | 6.52 | | Monthly Target 5 | 6.75 |
Monthly price and volumes Ngl Energy
| Date |
Closing |
Open |
Range |
Volume |
Mon 20 October 2025 |
6.29 (4.83%) |
6.00 |
5.80 - 6.39 |
0.3567 times |
Tue 30 September 2025 |
6.00 (10.91%) |
5.36 |
5.36 - 7.15 |
1.176 times |
Fri 29 August 2025 |
5.41 (27.29%) |
4.17 |
3.95 - 5.50 |
1.8287 times |
Thu 31 July 2025 |
4.25 (-0.47%) |
4.24 |
4.10 - 4.46 |
1.0725 times |
Mon 30 June 2025 |
4.27 (22.35%) |
3.54 |
3.32 - 4.86 |
1.0112 times |
Fri 30 May 2025 |
3.49 (17.51%) |
3.00 |
2.90 - 3.79 |
0.6272 times |
Wed 30 April 2025 |
2.97 (-34.58%) |
4.54 |
2.64 - 4.74 |
1.3273 times |
Mon 31 March 2025 |
4.54 (-6%) |
4.82 |
4.47 - 4.89 |
0.6389 times |
Fri 28 February 2025 |
4.83 (-11.86%) |
5.42 |
4.21 - 5.73 |
1.1403 times |
Fri 31 January 2025 |
5.48 (9.82%) |
5.00 |
4.78 - 5.70 |
0.8211 times |
Tue 31 December 2024 |
4.99 (5.27%) |
4.58 |
4.55 - 5.00 |
0.3974 times |

DMA SMA EMA moving averages of Ngl Energy NGL
DMA (daily moving average) of Ngl Energy NGL
| DMA period | DMA value | | 5 day DMA | 6.19 | | 12 day DMA | 6.11 | | 20 day DMA | 6.24 | | 35 day DMA | 6.04 | | 50 day DMA | 5.68 | | 100 day DMA | 4.89 | | 150 day DMA | 4.46 | | 200 day DMA | 4.61 | EMA (exponential moving average) of Ngl Energy NGL
| EMA period | EMA current | EMA prev | EMA prev2 | | 5 day EMA | 6.18 | 6.13 | 6.17 | | 12 day EMA | 6.15 | 6.13 | 6.15 | | 20 day EMA | 6.11 | 6.09 | 6.09 | | 35 day EMA | 5.87 | 5.84 | 5.83 | | 50 day EMA | 5.61 | 5.58 | 5.56 |
SMA (simple moving average) of Ngl Energy NGL
| SMA period | SMA current | SMA prev | SMA prev2 | | 5 day SMA | 6.19 | 6.17 | 6.18 | | 12 day SMA | 6.11 | 6.09 | 6.11 | | 20 day SMA | 6.24 | 6.25 | 6.27 | | 35 day SMA | 6.04 | 6.01 | 5.98 | | 50 day SMA | 5.68 | 5.64 | 5.6 | | 100 day SMA | 4.89 | 4.86 | 4.84 | | 150 day SMA | 4.46 | 4.45 | 4.44 | | 200 day SMA | 4.61 | 4.61 | 4.6 |
|
|
