NationalGrid NGG full analysis,charts,indicators,moving averages,SMA,DMA,EMA,ADX,MACD,RSINational Grid NGG WideScreen charts, DMA,SMA,EMA technical analysis, forecast prediction, by indicators ADX,MACD,RSI,CCI NYSE stock exchange
operates under Public Utilities sector & deals in Natural Gas Distribution
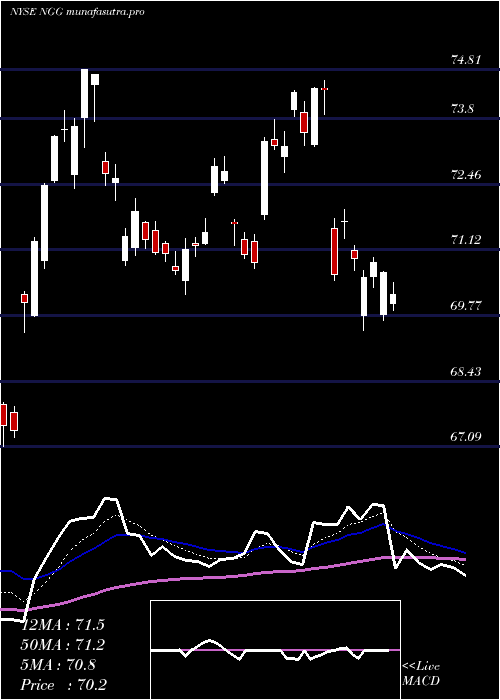
Daily price and charts and targets NationalGrid Strong Daily Stock price targets for NationalGrid NGG are 75.46 and 76.25 | Daily Target 1 | 75.3 | | Daily Target 2 | 75.61 | | Daily Target 3 | 76.093333333333 | | Daily Target 4 | 76.4 | | Daily Target 5 | 76.88 |
Daily price and volume National Grid
| Date |
Closing |
Open |
Range |
Volume |
Thu 04 December 2025 |
75.91 (-0.76%) |
76.25 |
75.79 - 76.58 |
0.5724 times |
Wed 03 December 2025 |
76.49 (1.12%) |
75.94 |
75.90 - 76.49 |
1.0889 times |
Tue 02 December 2025 |
75.64 (-0.01%) |
76.51 |
75.45 - 76.59 |
1.0525 times |
Mon 01 December 2025 |
75.65 (-0.6%) |
76.18 |
75.56 - 76.29 |
1.1663 times |
Fri 28 November 2025 |
76.11 (0.79%) |
75.79 |
75.64 - 76.16 |
0.6397 times |
Wed 26 November 2025 |
75.51 (1.94%) |
74.75 |
74.53 - 75.54 |
1.0308 times |
Tue 25 November 2025 |
74.07 (0.72%) |
74.00 |
73.98 - 74.55 |
1.005 times |
Mon 24 November 2025 |
73.54 (-2.19%) |
74.30 |
73.37 - 74.47 |
1.4463 times |
Fri 21 November 2025 |
75.19 (-0.84%) |
74.89 |
74.67 - 75.43 |
1.1291 times |
Thu 20 November 2025 |
75.83 (-0.34%) |
76.25 |
75.45 - 76.35 |
0.869 times |
Wed 19 November 2025 |
76.09 (-1.86%) |
76.74 |
75.94 - 77.02 |
1.0969 times |
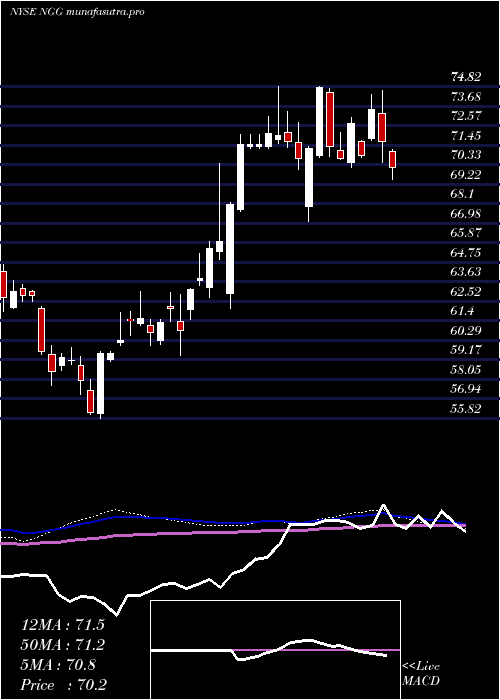
Weekly price and charts NationalGrid Strong weekly Stock price targets for NationalGrid NGG are 75.11 and 76.25 | Weekly Target 1 | 74.84 | | Weekly Target 2 | 75.38 | | Weekly Target 3 | 75.983333333333 | | Weekly Target 4 | 76.52 | | Weekly Target 5 | 77.12 |
Weekly price and volumes for National Grid
| Date |
Closing |
Open |
Range |
Volume |
Thu 04 December 2025 |
75.91 (-0.26%) |
76.18 |
75.45 - 76.59 |
0.9461 times |
Fri 28 November 2025 |
76.11 (1.22%) |
74.30 |
73.37 - 76.16 |
1.005 times |
Fri 21 November 2025 |
75.19 (-2.83%) |
77.83 |
74.67 - 78.27 |
1.2731 times |
Fri 14 November 2025 |
77.38 (-0.48%) |
77.16 |
76.79 - 78.49 |
1.2896 times |
Fri 07 November 2025 |
77.75 (3.32%) |
74.65 |
74.44 - 77.94 |
0.9002 times |
Fri 31 October 2025 |
75.25 (0%) |
75.32 |
74.91 - 75.41 |
0.1925 times |
Fri 31 October 2025 |
75.25 (-2.21%) |
77.31 |
74.91 - 77.35 |
0.84 times |
Fri 24 October 2025 |
76.95 (0%) |
76.66 |
76.24 - 77.27 |
0.9531 times |
Fri 17 October 2025 |
76.95 (3.26%) |
73.64 |
73.28 - 77.01 |
1.4403 times |
Fri 10 October 2025 |
74.52 (1.48%) |
72.68 |
72.41 - 74.58 |
1.1601 times |
Fri 03 October 2025 |
73.43 (2.63%) |
71.41 |
71.15 - 73.62 |
1.2447 times |
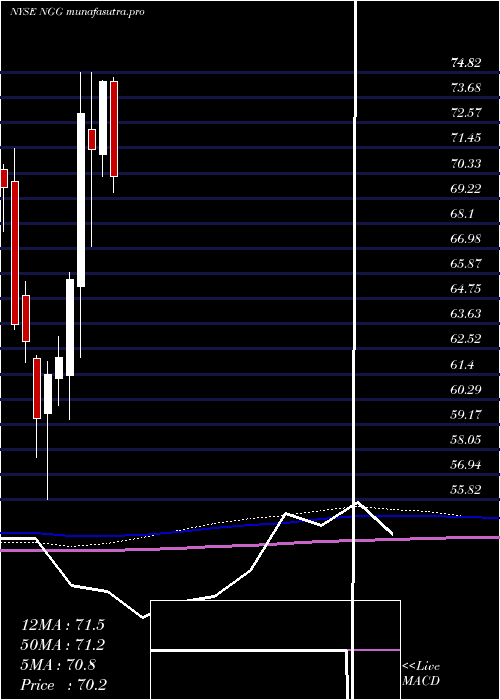
Monthly price and charts NationalGrid Strong monthly Stock price targets for NationalGrid NGG are 75.11 and 76.25 | Monthly Target 1 | 74.84 | | Monthly Target 2 | 75.38 | | Monthly Target 3 | 75.983333333333 | | Monthly Target 4 | 76.52 | | Monthly Target 5 | 77.12 |
Monthly price and volumes National Grid
| Date |
Closing |
Open |
Range |
Volume |
Thu 04 December 2025 |
75.91 (-0.26%) |
76.18 |
75.45 - 76.59 |
0.1825 times |
Fri 28 November 2025 |
76.11 (1.14%) |
74.65 |
73.37 - 78.49 |
0.862 times |
Fri 31 October 2025 |
75.25 (3.55%) |
73.08 |
71.94 - 77.35 |
1.0116 times |
Tue 30 September 2025 |
72.67 (2.98%) |
67.63 |
67.51 - 72.81 |
0.8134 times |
Fri 29 August 2025 |
70.57 (0.26%) |
71.78 |
69.93 - 72.97 |
0.7182 times |
Thu 31 July 2025 |
70.39 (-5.4%) |
74.41 |
69.47 - 74.58 |
1.3611 times |
Mon 30 June 2025 |
74.41 (4.23%) |
71.15 |
70.19 - 74.43 |
1.348 times |
Fri 30 May 2025 |
71.39 (-2.21%) |
72.25 |
67.09 - 74.81 |
1.6051 times |
Wed 30 April 2025 |
73.00 (11.26%) |
65.31 |
62.13 - 74.82 |
1.3693 times |
Mon 31 March 2025 |
65.61 (5.6%) |
61.34 |
59.39 - 65.93 |
0.7287 times |
Fri 28 February 2025 |
62.13 (1.19%) |
61.23 |
60.01 - 63.09 |
0.7258 times |
DMA SMA EMA moving averages of National Grid NGG
DMA (daily moving average) of National Grid NGG
| DMA period | DMA value | | 5 day DMA | 75.96 | | 12 day DMA | 75.63 | | 20 day DMA | 76.38 | | 35 day DMA | 76.3 | | 50 day DMA | 75.35 | | 100 day DMA | 73.2 | | 150 day DMA | 72.71 | | 200 day DMA | 70.99 | EMA (exponential moving average) of National Grid NGG
| EMA period | EMA current | EMA prev | EMA prev2 | | 5 day EMA | 75.88 | 75.86 | 75.55 | | 12 day EMA | 75.88 | 75.88 | 75.77 | | 20 day EMA | 75.92 | 75.92 | 75.86 | | 35 day EMA | 75.49 | 75.47 | 75.41 | | 50 day EMA | 75.04 | 75 | 74.94 |
SMA (simple moving average) of National Grid NGG
| SMA period | SMA current | SMA prev | SMA prev2 | | 5 day SMA | 75.96 | 75.88 | 75.4 | | 12 day SMA | 75.63 | 75.8 | 75.87 | | 20 day SMA | 76.38 | 76.36 | 76.29 | | 35 day SMA | 76.3 | 76.28 | 76.21 | | 50 day SMA | 75.35 | 75.26 | 75.16 | | 100 day SMA | 73.2 | 73.15 | 73.1 | | 150 day SMA | 72.71 | 72.69 | 72.67 | | 200 day SMA | 70.99 | 70.91 | 70.83 |
|
|
