CloudflareInc NET full analysis,charts,indicators,moving averages,SMA,DMA,EMA,ADX,MACD,RSICloudflare Inc NET WideScreen charts, DMA,SMA,EMA technical analysis, forecast prediction, by indicators ADX,MACD,RSI,CCI NYSE stock exchange
Daily price and charts and targets CloudflareInc Strong Daily Stock price targets for CloudflareInc NET are 202.41 and 207.32 | Daily Target 1 | 198.56 | | Daily Target 2 | 201.35 | | Daily Target 3 | 203.46666666667 | | Daily Target 4 | 206.26 | | Daily Target 5 | 208.38 |
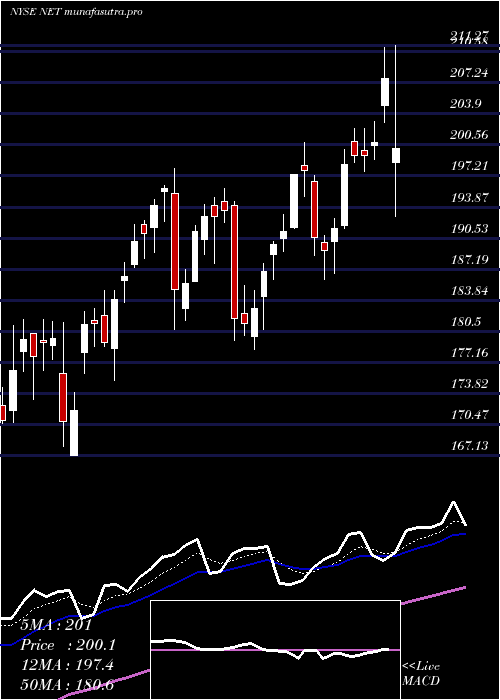
Daily price and volume Cloudflare Inc
| Date |
Closing |
Open |
Range |
Volume |
Thu 04 December 2025 |
204.15 (-0.1%) |
203.81 |
200.67 - 205.58 |
0.7305 times |
Wed 03 December 2025 |
204.35 (1.52%) |
199.70 |
198.05 - 204.81 |
0.7557 times |
Tue 02 December 2025 |
201.30 (2.08%) |
198.70 |
197.74 - 207.18 |
0.5845 times |
Mon 01 December 2025 |
197.20 (-1.5%) |
197.33 |
195.14 - 199.91 |
1.0676 times |
Fri 28 November 2025 |
200.21 (1.68%) |
198.22 |
197.62 - 201.85 |
0.4994 times |
Wed 26 November 2025 |
196.90 (-0.3%) |
198.50 |
195.11 - 199.79 |
0.6051 times |
Tue 25 November 2025 |
197.49 (1.92%) |
193.50 |
185.23 - 197.80 |
1.5747 times |
Mon 24 November 2025 |
193.77 (3.97%) |
188.31 |
187.00 - 194.16 |
0.8897 times |
Fri 21 November 2025 |
186.38 (-2.62%) |
191.60 |
181.16 - 191.60 |
1.6767 times |
Thu 20 November 2025 |
191.39 (-2.45%) |
204.47 |
189.79 - 204.47 |
1.616 times |
Wed 19 November 2025 |
196.20 (-0.17%) |
197.00 |
193.10 - 197.74 |
2.0283 times |
Weekly price and charts CloudflareInc Strong weekly Stock price targets for CloudflareInc NET are 199.65 and 211.69 | Weekly Target 1 | 190.12 | | Weekly Target 2 | 197.13 | | Weekly Target 3 | 202.15666666667 | | Weekly Target 4 | 209.17 | | Weekly Target 5 | 214.2 |
Weekly price and volumes for Cloudflare Inc
| Date |
Closing |
Open |
Range |
Volume |
Thu 04 December 2025 |
204.15 (1.97%) |
197.33 |
195.14 - 207.18 |
0.561 times |
Fri 28 November 2025 |
200.21 (7.42%) |
188.31 |
185.23 - 201.85 |
0.638 times |
Fri 21 November 2025 |
186.38 (-11.5%) |
213.44 |
181.16 - 213.70 |
2.1121 times |
Fri 14 November 2025 |
210.60 (-9.54%) |
238.65 |
204.19 - 244.50 |
1.0631 times |
Fri 07 November 2025 |
232.81 (-8.09%) |
240.25 |
218.43 - 245.63 |
0.9384 times |
Fri 31 October 2025 |
253.30 (0%) |
236.50 |
234.00 - 254.30 |
0.8558 times |
Fri 31 October 2025 |
253.30 (16.27%) |
222.44 |
219.29 - 254.30 |
1.8923 times |
Fri 24 October 2025 |
217.85 (3.73%) |
211.40 |
206.29 - 222.13 |
0.5297 times |
Fri 17 October 2025 |
210.01 (-3.39%) |
217.26 |
203.51 - 225.01 |
1.1096 times |
Tue 07 October 2025 |
217.39 (0.33%) |
218.00 |
213.68 - 225.37 |
0.2998 times |
Fri 03 October 2025 |
216.67 (0.15%) |
218.94 |
211.36 - 225.00 |
0.8816 times |

Monthly price and charts CloudflareInc Strong monthly Stock price targets for CloudflareInc NET are 199.65 and 211.69 | Monthly Target 1 | 190.12 | | Monthly Target 2 | 197.13 | | Monthly Target 3 | 202.15666666667 | | Monthly Target 4 | 209.17 | | Monthly Target 5 | 214.2 |
Monthly price and volumes Cloudflare Inc
| Date |
Closing |
Open |
Range |
Volume |
Thu 04 December 2025 |
204.15 (1.97%) |
197.33 |
195.14 - 207.18 |
0.1075 times |
Fri 28 November 2025 |
200.21 (-20.96%) |
240.25 |
181.16 - 245.63 |
0.9108 times |
Fri 31 October 2025 |
253.30 (18.04%) |
213.25 |
203.51 - 254.30 |
1.003 times |
Tue 30 September 2025 |
214.59 (2.82%) |
202.65 |
199.39 - 230.10 |
0.8291 times |
Fri 29 August 2025 |
208.71 (0.5%) |
198.66 |
184.52 - 219.00 |
0.8998 times |
Thu 31 July 2025 |
207.68 (6.05%) |
195.30 |
178.51 - 210.98 |
1.2462 times |
Mon 30 June 2025 |
195.83 (18.05%) |
165.00 |
162.28 - 196.20 |
1.1247 times |
Fri 30 May 2025 |
165.89 (37.35%) |
125.70 |
120.46 - 166.52 |
1.3293 times |
Wed 30 April 2025 |
120.78 (7.18%) |
114.17 |
89.42 - 122.87 |
1.2078 times |
Mon 31 March 2025 |
112.69 (-22.44%) |
145.95 |
106.10 - 149.16 |
1.3419 times |
Fri 28 February 2025 |
145.30 (4.99%) |
133.00 |
130.10 - 177.37 |
1.5939 times |

DMA SMA EMA moving averages of Cloudflare Inc NET
DMA (daily moving average) of Cloudflare Inc NET
| DMA period | DMA value | | 5 day DMA | 201.44 | | 12 day DMA | 197.16 | | 20 day DMA | 207.61 | | 35 day DMA | 214.63 | | 50 day DMA | 216.05 | | 100 day DMA | 210.08 | | 150 day DMA | 194.66 | | 200 day DMA | 176.7 | EMA (exponential moving average) of Cloudflare Inc NET
| EMA period | EMA current | EMA prev | EMA prev2 | | 5 day EMA | 201.77 | 200.58 | 198.7 | | 12 day EMA | 202.38 | 202.06 | 201.64 | | 20 day EMA | 205.97 | 206.16 | 206.35 | | 35 day EMA | 209.91 | 210.25 | 210.6 | | 50 day EMA | 215.08 | 215.53 | 215.99 |
SMA (simple moving average) of Cloudflare Inc NET
| SMA period | SMA current | SMA prev | SMA prev2 | | 5 day SMA | 201.44 | 199.99 | 198.62 | | 12 day SMA | 197.16 | 197 | 197.52 | | 20 day SMA | 207.61 | 208.82 | 210.25 | | 35 day SMA | 214.63 | 215.01 | 215.39 | | 50 day SMA | 216.05 | 216.49 | 216.87 | | 100 day SMA | 210.08 | 209.86 | 209.75 | | 150 day SMA | 194.66 | 194.1 | 193.53 | | 200 day SMA | 176.7 | 176.56 | 176.4 |
|
|
