NexteraEnergy NEE-N full analysis,charts,indicators,moving averages,SMA,DMA,EMA,ADX,MACD,RSINextera Energy NEE-N WideScreen charts, DMA,SMA,EMA technical analysis, forecast prediction, by indicators ADX,MACD,RSI,CCI NYSE stock exchange
Daily price and charts and targets NexteraEnergy Strong Daily Stock price targets for NexteraEnergy NEE-N are 24.6 and 24.75 | Daily Target 1 | 24.48 | | Daily Target 2 | 24.57 | | Daily Target 3 | 24.633333333333 | | Daily Target 4 | 24.72 | | Daily Target 5 | 24.78 |
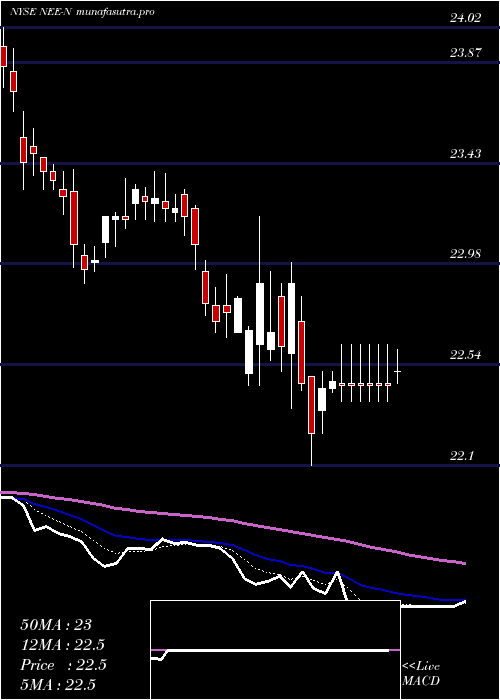
Daily price and volume Nextera Energy
| Date |
Closing |
Open |
Range |
Volume |
Mon 20 October 2025 |
24.65 (0.33%) |
24.63 |
24.55 - 24.70 |
0.8225 times |
Fri 17 October 2025 |
24.57 (0.57%) |
24.55 |
24.37 - 24.61 |
1.1075 times |
Thu 16 October 2025 |
24.43 (-0.37%) |
24.49 |
24.42 - 24.62 |
0.706 times |
Wed 15 October 2025 |
24.52 (0.41%) |
24.44 |
24.43 - 24.58 |
0.421 times |
Tue 14 October 2025 |
24.42 (-0.33%) |
24.50 |
24.39 - 24.54 |
1.9106 times |
Mon 13 October 2025 |
24.50 (0.7%) |
24.47 |
24.37 - 24.60 |
0.516 times |
Fri 10 October 2025 |
24.33 (-0.9%) |
24.59 |
24.31 - 24.64 |
0.6326 times |
Thu 09 October 2025 |
24.55 (-0.37%) |
24.66 |
24.48 - 24.66 |
0.8571 times |
Wed 08 October 2025 |
24.64 (0.28%) |
24.65 |
24.54 - 24.71 |
1.0233 times |
Tue 07 October 2025 |
24.57 (0%) |
24.57 |
24.50 - 24.66 |
2.0035 times |
Mon 06 October 2025 |
24.57 (0.57%) |
24.49 |
24.49 - 24.60 |
0.6023 times |
Weekly price and charts NexteraEnergy Strong weekly Stock price targets for NexteraEnergy NEE-N are 24.6 and 24.75 | Weekly Target 1 | 24.48 | | Weekly Target 2 | 24.57 | | Weekly Target 3 | 24.633333333333 | | Weekly Target 4 | 24.72 | | Weekly Target 5 | 24.78 |
Weekly price and volumes for Nextera Energy
| Date |
Closing |
Open |
Range |
Volume |
Mon 20 October 2025 |
24.65 (0.33%) |
24.63 |
24.55 - 24.70 |
0.1907 times |
Fri 17 October 2025 |
24.57 (0.99%) |
24.47 |
24.37 - 24.62 |
1.0804 times |
Fri 10 October 2025 |
24.33 (-0.41%) |
24.49 |
24.31 - 24.71 |
1.1865 times |
Fri 03 October 2025 |
24.43 (-0.12%) |
24.46 |
24.28 - 24.64 |
1.222 times |
Fri 26 September 2025 |
24.46 (-0.61%) |
24.58 |
24.24 - 24.65 |
1.0619 times |
Fri 19 September 2025 |
24.61 (0.7%) |
24.48 |
24.29 - 24.88 |
1.0924 times |
Fri 12 September 2025 |
24.44 (2.43%) |
23.90 |
23.72 - 24.44 |
1.0994 times |
Fri 05 September 2025 |
23.86 (2.62%) |
23.22 |
22.94 - 23.93 |
1.118 times |
Fri 29 August 2025 |
23.25 (0%) |
23.36 |
23.13 - 23.36 |
0.5159 times |
Fri 29 August 2025 |
23.25 (-0.09%) |
23.27 |
23.13 - 23.68 |
1.4327 times |
Fri 22 August 2025 |
23.27 (2.42%) |
22.76 |
22.73 - 23.31 |
1.3271 times |

Monthly price and charts NexteraEnergy Strong monthly Stock price targets for NexteraEnergy NEE-N are 24.48 and 24.88 | Monthly Target 1 | 24.16 | | Monthly Target 2 | 24.4 | | Monthly Target 3 | 24.556666666667 | | Monthly Target 4 | 24.8 | | Monthly Target 5 | 24.96 |
Monthly price and volumes Nextera Energy
| Date |
Closing |
Open |
Range |
Volume |
Mon 20 October 2025 |
24.65 (1.4%) |
24.37 |
24.31 - 24.71 |
0.4927 times |
Tue 30 September 2025 |
24.31 (4.56%) |
23.22 |
22.94 - 24.88 |
0.9268 times |
Fri 29 August 2025 |
23.25 (3.29%) |
22.49 |
22.46 - 23.68 |
0.9564 times |
Thu 31 July 2025 |
22.51 (1.81%) |
22.13 |
22.02 - 22.70 |
1.2059 times |
Mon 30 June 2025 |
22.11 (-0.85%) |
22.33 |
21.85 - 22.48 |
1.0532 times |
Fri 30 May 2025 |
22.30 (-2.79%) |
23.06 |
22.23 - 23.15 |
0.9369 times |
Wed 30 April 2025 |
22.94 (0.92%) |
22.80 |
22.10 - 23.19 |
1.1521 times |
Mon 31 March 2025 |
22.73 (-2.99%) |
23.50 |
22.68 - 23.58 |
1.1369 times |
Fri 28 February 2025 |
23.43 (-0.26%) |
23.43 |
23.31 - 24.08 |
0.7842 times |
Fri 31 January 2025 |
23.49 (1.25%) |
23.39 |
22.80 - 24.32 |
1.355 times |
Tue 31 December 2024 |
23.20 (-6.38%) |
24.37 |
23.02 - 24.52 |
1.568 times |

DMA SMA EMA moving averages of Nextera Energy NEE-N
DMA (daily moving average) of Nextera Energy NEE-N
| DMA period | DMA value | | 5 day DMA | 24.52 | | 12 day DMA | 24.52 | | 20 day DMA | 24.5 | | 35 day DMA | 24.3 | | 50 day DMA | 23.93 | | 100 day DMA | 23.13 | | 150 day DMA | 23.01 | | 200 day DMA | 23.16 | EMA (exponential moving average) of Nextera Energy NEE-N
| EMA period | EMA current | EMA prev | EMA prev2 | | 5 day EMA | 24.55 | 24.5 | 24.47 | | 12 day EMA | 24.51 | 24.48 | 24.46 | | 20 day EMA | 24.43 | 24.41 | 24.39 | | 35 day EMA | 24.18 | 24.15 | 24.12 | | 50 day EMA | 23.88 | 23.85 | 23.82 |
SMA (simple moving average) of Nextera Energy NEE-N
| SMA period | SMA current | SMA prev | SMA prev2 | | 5 day SMA | 24.52 | 24.49 | 24.44 | | 12 day SMA | 24.52 | 24.51 | 24.49 | | 20 day SMA | 24.5 | 24.5 | 24.5 | | 35 day SMA | 24.3 | 24.26 | 24.23 | | 50 day SMA | 23.93 | 23.89 | 23.85 | | 100 day SMA | 23.13 | 23.11 | 23.09 | | 150 day SMA | 23.01 | 23 | 22.99 | | 200 day SMA | 23.16 | 23.15 | 23.15 |
|
|
