BlackrockMuniyield MYN full analysis,charts,indicators,moving averages,SMA,DMA,EMA,ADX,MACD,RSIBlackrock Muniyield MYN WideScreen charts, DMA,SMA,EMA technical analysis, forecast prediction, by indicators ADX,MACD,RSI,CCI NYSE stock exchange
operates under N A sector & deals in N A
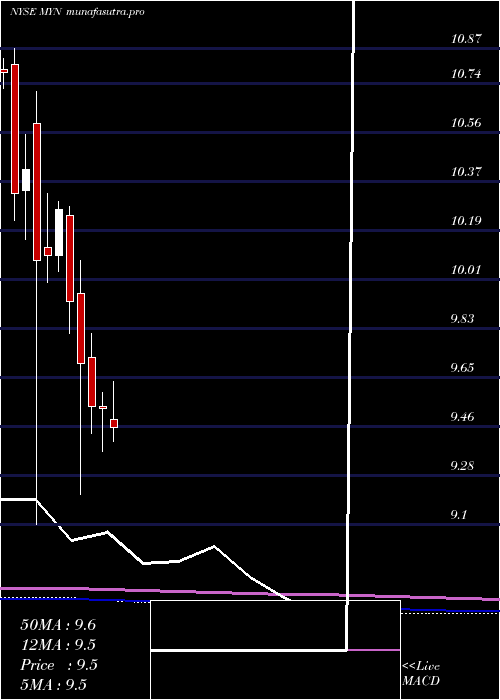
Daily price and charts and targets BlackrockMuniyield Strong Daily Stock price targets for BlackrockMuniyield MYN are 10.16 and 10.22 | Daily Target 1 | 10.11 | | Daily Target 2 | 10.14 | | Daily Target 3 | 10.166666666667 | | Daily Target 4 | 10.2 | | Daily Target 5 | 10.23 |
Daily price and volume Blackrock Muniyield
| Date |
Closing |
Open |
Range |
Volume |
Thu 04 December 2025 |
10.18 (0.2%) |
10.16 |
10.13 - 10.19 |
1.331 times |
Wed 03 December 2025 |
10.16 (0.59%) |
10.08 |
10.08 - 10.19 |
1.864 times |
Tue 02 December 2025 |
10.10 (-0.1%) |
10.11 |
10.08 - 10.14 |
1.4973 times |
Mon 01 December 2025 |
10.11 (0.6%) |
10.05 |
10.02 - 10.11 |
1.1232 times |
Fri 28 November 2025 |
10.05 (-0.2%) |
10.08 |
10.05 - 10.10 |
0.3029 times |
Wed 26 November 2025 |
10.07 (-0.2%) |
10.11 |
10.04 - 10.15 |
0.2487 times |
Tue 25 November 2025 |
10.09 (0.8%) |
10.06 |
10.06 - 10.13 |
1.2174 times |
Mon 24 November 2025 |
10.01 (0.81%) |
9.96 |
9.95 - 10.02 |
0.6748 times |
Fri 21 November 2025 |
9.93 (0.1%) |
9.96 |
9.92 - 9.99 |
0.5434 times |
Thu 20 November 2025 |
9.92 (-0.5%) |
9.96 |
9.92 - 9.99 |
1.1974 times |
Wed 19 November 2025 |
9.97 (-0.1%) |
9.97 |
9.96 - 10.01 |
0.4684 times |
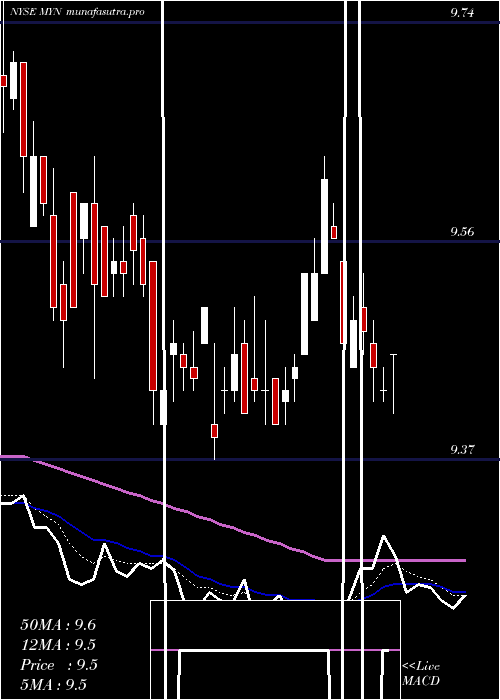
Weekly price and charts BlackrockMuniyield Strong weekly Stock price targets for BlackrockMuniyield MYN are 10.1 and 10.27 | Weekly Target 1 | 9.96 | | Weekly Target 2 | 10.07 | | Weekly Target 3 | 10.13 | | Weekly Target 4 | 10.24 | | Weekly Target 5 | 10.3 |
Weekly price and volumes for Blackrock Muniyield
| Date |
Closing |
Open |
Range |
Volume |
Thu 04 December 2025 |
10.18 (1.29%) |
10.05 |
10.02 - 10.19 |
1.9297 times |
Fri 28 November 2025 |
10.05 (1.21%) |
9.96 |
9.95 - 10.15 |
0.8109 times |
Fri 21 November 2025 |
9.93 (-0.3%) |
9.97 |
9.92 - 10.01 |
1.0237 times |
Fri 14 November 2025 |
9.96 (0.1%) |
9.98 |
9.90 - 10.04 |
1.6122 times |
Fri 07 November 2025 |
9.95 (-1.68%) |
10.05 |
9.91 - 10.08 |
1.1727 times |
Fri 31 October 2025 |
10.12 (0%) |
10.05 |
10.01 - 10.12 |
0.1904 times |
Fri 31 October 2025 |
10.12 (-0.78%) |
10.20 |
10.01 - 10.22 |
1.1927 times |
Fri 24 October 2025 |
10.20 (0.39%) |
10.19 |
10.15 - 10.21 |
0.6183 times |
Fri 17 October 2025 |
10.16 (0.1%) |
10.14 |
10.10 - 10.26 |
0.9609 times |
Tue 07 October 2025 |
10.15 (1.4%) |
9.99 |
9.96 - 10.18 |
0.4886 times |
Fri 03 October 2025 |
10.01 (1.73%) |
9.87 |
9.80 - 10.25 |
0.7306 times |
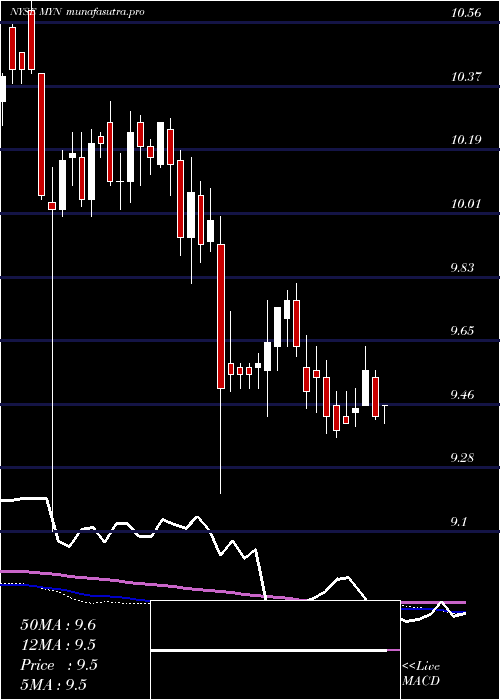
Monthly price and charts BlackrockMuniyield Strong monthly Stock price targets for BlackrockMuniyield MYN are 10.1 and 10.27 | Monthly Target 1 | 9.96 | | Monthly Target 2 | 10.07 | | Monthly Target 3 | 10.13 | | Monthly Target 4 | 10.24 | | Monthly Target 5 | 10.3 |
Monthly price and volumes Blackrock Muniyield
| Date |
Closing |
Open |
Range |
Volume |
Thu 04 December 2025 |
10.18 (1.29%) |
10.05 |
10.02 - 10.19 |
0.4313 times |
Fri 28 November 2025 |
10.05 (-0.69%) |
10.05 |
9.90 - 10.15 |
1.0326 times |
Fri 31 October 2025 |
10.12 (1.91%) |
9.97 |
9.93 - 10.26 |
0.8674 times |
Tue 30 September 2025 |
9.93 (6.55%) |
9.29 |
9.20 - 9.96 |
1.4618 times |
Fri 29 August 2025 |
9.32 (1.3%) |
9.21 |
9.12 - 9.48 |
1.082 times |
Thu 31 July 2025 |
9.20 (-3.46%) |
9.49 |
9.13 - 9.63 |
1.0776 times |
Mon 30 June 2025 |
9.53 (-0.1%) |
9.54 |
9.37 - 9.59 |
0.9085 times |
Fri 30 May 2025 |
9.54 (-1.65%) |
9.72 |
9.44 - 9.81 |
0.8744 times |
Wed 30 April 2025 |
9.70 (-2.32%) |
9.96 |
9.21 - 10.08 |
1.1784 times |
Mon 31 March 2025 |
9.93 (-3.31%) |
10.25 |
9.81 - 10.28 |
1.0861 times |
Fri 28 February 2025 |
10.27 (1.68%) |
10.10 |
10.04 - 10.30 |
0.9977 times |
DMA SMA EMA moving averages of Blackrock Muniyield MYN
DMA (daily moving average) of Blackrock Muniyield MYN
| DMA period | DMA value | | 5 day DMA | 10.12 | | 12 day DMA | 10.05 | | 20 day DMA | 10.01 | | 35 day DMA | 10.06 | | 50 day DMA | 10.04 | | 100 day DMA | 9.73 | | 150 day DMA | 9.67 | | 200 day DMA | 9.73 | EMA (exponential moving average) of Blackrock Muniyield MYN
| EMA period | EMA current | EMA prev | EMA prev2 | | 5 day EMA | 10.13 | 10.1 | 10.07 | | 12 day EMA | 10.08 | 10.06 | 10.04 | | 20 day EMA | 10.05 | 10.04 | 10.03 | | 35 day EMA | 10.04 | 10.03 | 10.02 | | 50 day EMA | 10.04 | 10.03 | 10.02 |
SMA (simple moving average) of Blackrock Muniyield MYN
| SMA period | SMA current | SMA prev | SMA prev2 | | 5 day SMA | 10.12 | 10.1 | 10.08 | | 12 day SMA | 10.05 | 10.03 | 10.01 | | 20 day SMA | 10.01 | 10 | 10 | | 35 day SMA | 10.06 | 10.06 | 10.07 | | 50 day SMA | 10.04 | 10.03 | 10.03 | | 100 day SMA | 9.73 | 9.72 | 9.71 | | 150 day SMA | 9.67 | 9.67 | 9.66 | | 200 day SMA | 9.73 | 9.73 | 9.73 |
|
|
