BlackrockMuniyield MYI full analysis,charts,indicators,moving averages,SMA,DMA,EMA,ADX,MACD,RSIBlackrock Muniyield MYI WideScreen charts, DMA,SMA,EMA technical analysis, forecast prediction, by indicators ADX,MACD,RSI,CCI NYSE stock exchange
operates under N A sector & deals in N A
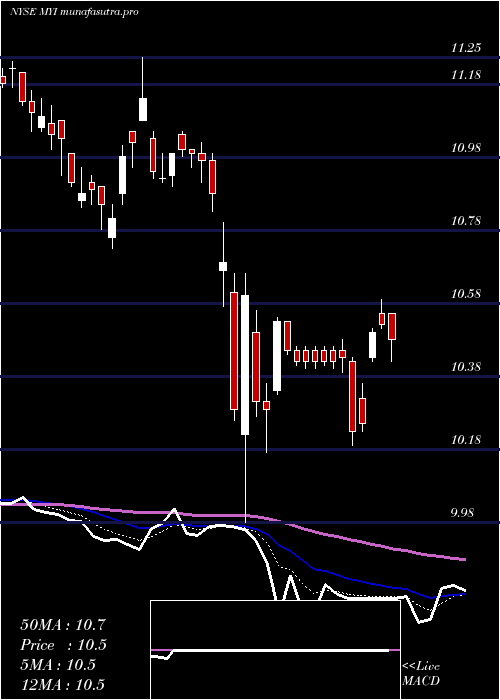
Daily price and charts and targets BlackrockMuniyield Strong Daily Stock price targets for BlackrockMuniyield MYI are 11.05 and 11.13 | Daily Target 1 | 10.98 | | Daily Target 2 | 11.03 | | Daily Target 3 | 11.063333333333 | | Daily Target 4 | 11.11 | | Daily Target 5 | 11.14 |
Daily price and volume Blackrock Muniyield
| Date |
Closing |
Open |
Range |
Volume |
Fri 05 December 2025 |
11.07 (0.09%) |
11.06 |
11.02 - 11.10 |
0.7986 times |
Thu 04 December 2025 |
11.06 (0.09%) |
11.05 |
11.00 - 11.46 |
0.9611 times |
Wed 03 December 2025 |
11.05 (1.28%) |
10.94 |
10.92 - 11.05 |
2.3702 times |
Tue 02 December 2025 |
10.91 (0.09%) |
10.89 |
10.85 - 10.94 |
0.9877 times |
Mon 01 December 2025 |
10.90 (-0.37%) |
10.90 |
10.86 - 10.94 |
1.0058 times |
Fri 28 November 2025 |
10.94 (0.09%) |
10.92 |
10.91 - 10.95 |
0.4284 times |
Wed 26 November 2025 |
10.93 (0.18%) |
10.91 |
10.88 - 10.93 |
0.7509 times |
Tue 25 November 2025 |
10.91 (0.09%) |
10.87 |
10.87 - 10.93 |
1.0399 times |
Mon 24 November 2025 |
10.90 (0.55%) |
10.88 |
10.86 - 10.90 |
0.9531 times |
Fri 21 November 2025 |
10.84 (-0.37%) |
10.91 |
10.83 - 10.91 |
0.7043 times |
Thu 20 November 2025 |
10.88 (-0.37%) |
10.91 |
10.85 - 10.94 |
0.3787 times |
Weekly price and charts BlackrockMuniyield Strong weekly Stock price targets for BlackrockMuniyield MYI are 10.96 and 11.57 | Weekly Target 1 | 10.52 | | Weekly Target 2 | 10.79 | | Weekly Target 3 | 11.126666666667 | | Weekly Target 4 | 11.4 | | Weekly Target 5 | 11.74 |
Weekly price and volumes for Blackrock Muniyield
| Date |
Closing |
Open |
Range |
Volume |
Fri 05 December 2025 |
11.07 (1.19%) |
10.90 |
10.85 - 11.46 |
1.6061 times |
Fri 28 November 2025 |
10.94 (0.92%) |
10.88 |
10.86 - 10.95 |
0.8321 times |
Fri 21 November 2025 |
10.84 (-1.54%) |
11.03 |
10.83 - 11.03 |
0.6989 times |
Fri 14 November 2025 |
11.01 (0%) |
11.06 |
10.96 - 11.12 |
0.8665 times |
Fri 07 November 2025 |
11.01 (-0.27%) |
11.02 |
10.98 - 11.15 |
0.9524 times |
Fri 31 October 2025 |
11.04 (0%) |
11.00 |
11.00 - 11.08 |
0.251 times |
Fri 31 October 2025 |
11.04 (0.64%) |
10.97 |
10.96 - 11.08 |
1.6203 times |
Fri 24 October 2025 |
10.97 (-0.27%) |
11.02 |
10.95 - 11.07 |
1.7592 times |
Fri 17 October 2025 |
11.00 (-0.45%) |
11.13 |
10.95 - 11.19 |
0.7615 times |
Tue 07 October 2025 |
11.05 (0.82%) |
10.96 |
10.93 - 11.07 |
0.6519 times |
Fri 03 October 2025 |
10.96 (0%) |
11.00 |
10.91 - 11.10 |
0.9109 times |
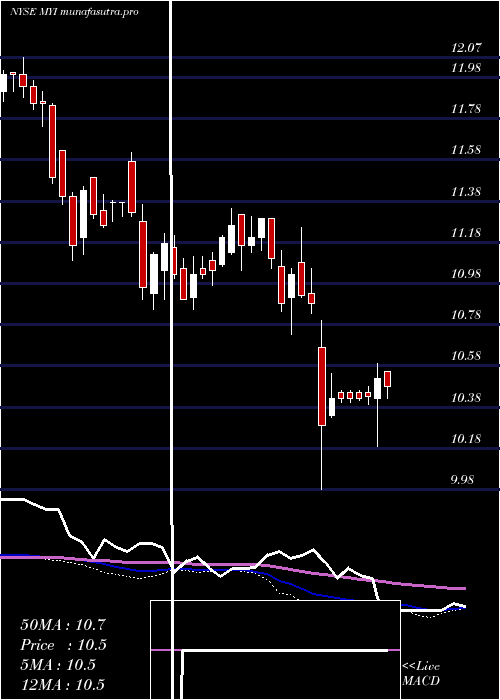
Monthly price and charts BlackrockMuniyield Strong monthly Stock price targets for BlackrockMuniyield MYI are 10.96 and 11.57 | Monthly Target 1 | 10.52 | | Monthly Target 2 | 10.79 | | Monthly Target 3 | 11.126666666667 | | Monthly Target 4 | 11.4 | | Monthly Target 5 | 11.74 |
Monthly price and volumes Blackrock Muniyield
| Date |
Closing |
Open |
Range |
Volume |
Fri 05 December 2025 |
11.07 (1.19%) |
10.90 |
10.85 - 11.46 |
0.337 times |
Fri 28 November 2025 |
10.94 (-0.91%) |
11.02 |
10.83 - 11.15 |
0.7028 times |
Fri 31 October 2025 |
11.04 (-0.36%) |
11.07 |
10.93 - 11.19 |
1.1712 times |
Tue 30 September 2025 |
11.08 (4.53%) |
10.57 |
10.49 - 11.11 |
1.1195 times |
Fri 29 August 2025 |
10.60 (2.12%) |
10.36 |
10.33 - 10.60 |
1.0215 times |
Thu 31 July 2025 |
10.38 (-1.05%) |
10.50 |
10.20 - 10.65 |
1.0076 times |
Mon 30 June 2025 |
10.49 (0.58%) |
10.45 |
10.32 - 10.50 |
0.875 times |
Fri 30 May 2025 |
10.43 (-1.23%) |
10.62 |
10.26 - 10.75 |
0.9641 times |
Wed 30 April 2025 |
10.56 (-3.91%) |
11.04 |
9.98 - 11.05 |
1.7005 times |
Mon 31 March 2025 |
10.99 (-2.66%) |
11.29 |
10.73 - 11.29 |
1.1008 times |
Fri 28 February 2025 |
11.29 (0.8%) |
11.13 |
11.04 - 11.34 |
0.9764 times |

DMA SMA EMA moving averages of Blackrock Muniyield MYI
DMA (daily moving average) of Blackrock Muniyield MYI
| DMA period | DMA value | | 5 day DMA | 11 | | 12 day DMA | 10.94 | | 20 day DMA | 10.98 | | 35 day DMA | 10.99 | | 50 day DMA | 11 | | 100 day DMA | 10.78 | | 150 day DMA | 10.69 | | 200 day DMA | 10.73 | EMA (exponential moving average) of Blackrock Muniyield MYI
| EMA period | EMA current | EMA prev | EMA prev2 | | 5 day EMA | 11.02 | 10.99 | 10.96 | | 12 day EMA | 10.99 | 10.97 | 10.95 | | 20 day EMA | 10.98 | 10.97 | 10.96 | | 35 day EMA | 10.99 | 10.98 | 10.98 | | 50 day EMA | 11 | 11 | 11 |
SMA (simple moving average) of Blackrock Muniyield MYI
| SMA period | SMA current | SMA prev | SMA prev2 | | 5 day SMA | 11 | 10.97 | 10.95 | | 12 day SMA | 10.94 | 10.93 | 10.93 | | 20 day SMA | 10.98 | 10.98 | 10.98 | | 35 day SMA | 10.99 | 10.99 | 10.99 | | 50 day SMA | 11 | 11 | 11 | | 100 day SMA | 10.78 | 10.78 | 10.77 | | 150 day SMA | 10.69 | 10.69 | 10.68 | | 200 day SMA | 10.73 | 10.73 | 10.73 |
|
|
