MyersIndustries MYE full analysis,charts,indicators,moving averages,SMA,DMA,EMA,ADX,MACD,RSIMyers Industries MYE WideScreen charts, DMA,SMA,EMA technical analysis, forecast prediction, by indicators ADX,MACD,RSI,CCI NYSE stock exchange
operates under Consumer Non Durables sector & deals in Plastic Products
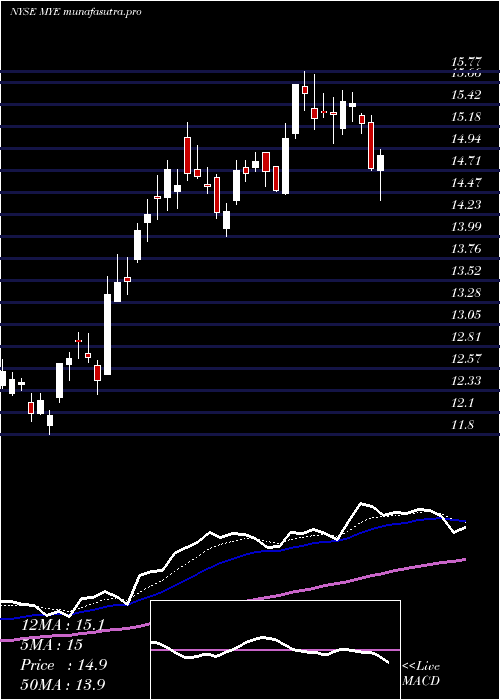
Daily price and charts and targets MyersIndustries Strong Daily Stock price targets for MyersIndustries MYE are 16.16 and 16.44 | Daily Target 1 | 15.94 | | Daily Target 2 | 16.1 | | Daily Target 3 | 16.216666666667 | | Daily Target 4 | 16.38 | | Daily Target 5 | 16.5 |
Daily price and volume Myers Industries
| Date |
Closing |
Open |
Range |
Volume |
Fri 17 October 2025 |
16.27 (0.37%) |
16.10 |
16.05 - 16.33 |
1.2156 times |
Thu 16 October 2025 |
16.21 (-0.06%) |
16.20 |
16.10 - 16.40 |
1.0064 times |
Wed 15 October 2025 |
16.22 (1.31%) |
16.09 |
16.02 - 16.27 |
1.0476 times |
Tue 14 October 2025 |
16.01 (1.59%) |
15.59 |
15.54 - 16.07 |
0.9992 times |
Mon 13 October 2025 |
15.76 (-5.46%) |
16.00 |
15.74 - 16.11 |
1.2858 times |
Tue 07 October 2025 |
16.67 (-1.01%) |
16.84 |
16.60 - 16.89 |
0.8762 times |
Mon 06 October 2025 |
16.84 (0.36%) |
16.83 |
16.71 - 17.05 |
0.8142 times |
Fri 03 October 2025 |
16.78 (0.48%) |
16.83 |
16.67 - 17.05 |
1.0577 times |
Thu 02 October 2025 |
16.70 (-2.05%) |
17.06 |
16.65 - 17.06 |
0.5845 times |
Wed 01 October 2025 |
17.05 (0.65%) |
16.79 |
16.79 - 17.24 |
1.1129 times |
Tue 30 September 2025 |
16.94 (1.56%) |
16.56 |
16.56 - 16.97 |
0.929 times |
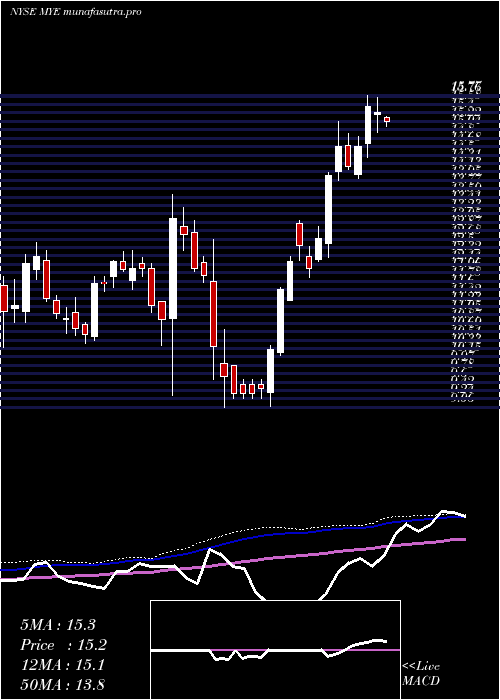
Weekly price and charts MyersIndustries Strong weekly Stock price targets for MyersIndustries MYE are 15.91 and 16.77 | Weekly Target 1 | 15.21 | | Weekly Target 2 | 15.74 | | Weekly Target 3 | 16.07 | | Weekly Target 4 | 16.6 | | Weekly Target 5 | 16.93 |
Weekly price and volumes for Myers Industries
| Date |
Closing |
Open |
Range |
Volume |
Fri 17 October 2025 |
16.27 (-2.4%) |
16.00 |
15.54 - 16.40 |
1.2428 times |
Tue 07 October 2025 |
16.67 (-0.66%) |
16.83 |
16.60 - 17.05 |
0.3782 times |
Fri 03 October 2025 |
16.78 (0.48%) |
16.76 |
16.54 - 17.24 |
0.9901 times |
Fri 26 September 2025 |
16.70 (0.91%) |
16.57 |
16.46 - 17.25 |
1.352 times |
Fri 19 September 2025 |
16.55 (5.41%) |
15.74 |
15.71 - 16.60 |
1.5016 times |
Fri 12 September 2025 |
15.70 (-3.8%) |
16.44 |
15.69 - 16.44 |
1.1122 times |
Fri 05 September 2025 |
16.32 (-2.51%) |
16.51 |
16.04 - 16.89 |
0.8654 times |
Fri 29 August 2025 |
16.74 (0%) |
16.97 |
16.54 - 16.97 |
0.1932 times |
Fri 29 August 2025 |
16.74 (0.84%) |
16.55 |
16.28 - 17.12 |
1.1354 times |
Fri 22 August 2025 |
16.60 (2.98%) |
16.12 |
15.93 - 16.77 |
1.229 times |
Fri 15 August 2025 |
16.12 (1.77%) |
15.93 |
15.71 - 16.85 |
1.2443 times |
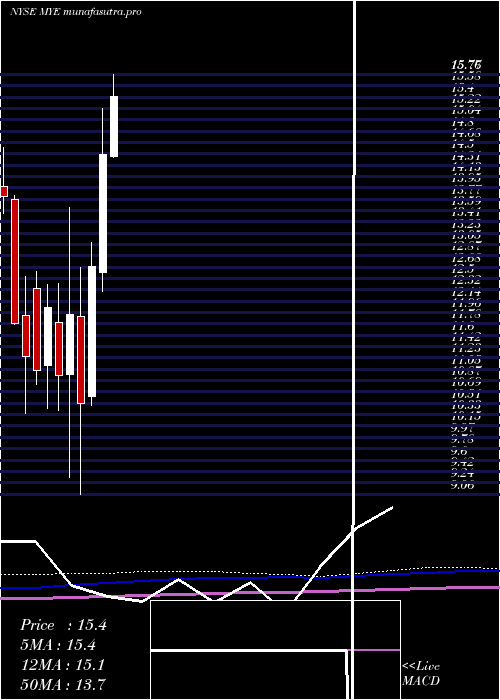
Monthly price and charts MyersIndustries Strong monthly Stock price targets for MyersIndustries MYE are 15.06 and 16.76 | Monthly Target 1 | 14.65 | | Monthly Target 2 | 15.46 | | Monthly Target 3 | 16.35 | | Monthly Target 4 | 17.16 | | Monthly Target 5 | 18.05 |
Monthly price and volumes Myers Industries
| Date |
Closing |
Open |
Range |
Volume |
Fri 17 October 2025 |
16.27 (-3.96%) |
16.79 |
15.54 - 17.24 |
0.3926 times |
Tue 30 September 2025 |
16.94 (1.19%) |
16.51 |
15.69 - 17.25 |
0.9131 times |
Fri 29 August 2025 |
16.74 (14.27%) |
14.32 |
14.09 - 17.12 |
0.8672 times |
Thu 31 July 2025 |
14.65 (1.1%) |
14.46 |
12.96 - 15.77 |
0.827 times |
Mon 30 June 2025 |
14.49 (14.18%) |
12.60 |
12.29 - 15.22 |
1.1928 times |
Fri 30 May 2025 |
12.69 (20.86%) |
10.62 |
10.48 - 13.08 |
0.8356 times |
Wed 30 April 2025 |
10.50 (-11.99%) |
11.90 |
9.06 - 12.68 |
1.132 times |
Mon 31 March 2025 |
11.93 (8.85%) |
10.97 |
9.32 - 13.64 |
1.7453 times |
Fri 28 February 2025 |
10.96 (-8.97%) |
11.80 |
10.40 - 12.43 |
1.1053 times |
Fri 31 January 2025 |
12.04 (9.06%) |
11.11 |
10.43 - 12.41 |
0.989 times |
Tue 31 December 2024 |
11.04 (-1.87%) |
12.34 |
10.81 - 12.61 |
1.0937 times |
DMA SMA EMA moving averages of Myers Industries MYE
DMA (daily moving average) of Myers Industries MYE
| DMA period | DMA value | | 5 day DMA | 16.09 | | 12 day DMA | 16.51 | | 20 day DMA | 16.53 | | 35 day DMA | 16.46 | | 50 day DMA | 16.39 | | 100 day DMA | 15.4 | | 150 day DMA | 14.02 | | 200 day DMA | 13.4 | EMA (exponential moving average) of Myers Industries MYE
| EMA period | EMA current | EMA prev | EMA prev2 | | 5 day EMA | 16.26 | 16.25 | 16.27 | | 12 day EMA | 16.38 | 16.4 | 16.44 | | 20 day EMA | 16.42 | 16.44 | 16.46 | | 35 day EMA | 16.36 | 16.37 | 16.38 | | 50 day EMA | 16.25 | 16.25 | 16.25 |
SMA (simple moving average) of Myers Industries MYE
| SMA period | SMA current | SMA prev | SMA prev2 | | 5 day SMA | 16.09 | 16.17 | 16.3 | | 12 day SMA | 16.51 | 16.55 | 16.58 | | 20 day SMA | 16.53 | 16.51 | 16.5 | | 35 day SMA | 16.46 | 16.48 | 16.48 | | 50 day SMA | 16.39 | 16.38 | 16.36 | | 100 day SMA | 15.4 | 15.36 | 15.32 | | 150 day SMA | 14.02 | 14 | 13.98 | | 200 day SMA | 13.4 | 13.38 | 13.35 |
|
|
