BlackrockMuniyield MYD full analysis,charts,indicators,moving averages,SMA,DMA,EMA,ADX,MACD,RSIBlackrock Muniyield MYD WideScreen charts, DMA,SMA,EMA technical analysis, forecast prediction, by indicators ADX,MACD,RSI,CCI NYSE stock exchange
operates under N A sector & deals in N A
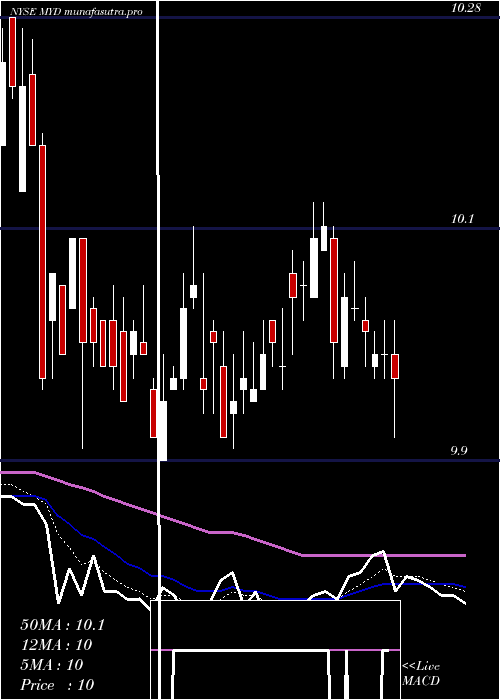
Daily price and charts and targets BlackrockMuniyield Strong Daily Stock price targets for BlackrockMuniyield MYD are 10.48 and 10.56 | Daily Target 1 | 10.42 | | Daily Target 2 | 10.46 | | Daily Target 3 | 10.5 | | Daily Target 4 | 10.54 | | Daily Target 5 | 10.58 |
Daily price and volume Blackrock Muniyield
| Date |
Closing |
Open |
Range |
Volume |
Thu 04 December 2025 |
10.50 (0.19%) |
10.47 |
10.46 - 10.54 |
1.0496 times |
Wed 03 December 2025 |
10.48 (0.67%) |
10.38 |
10.38 - 10.51 |
1.2284 times |
Tue 02 December 2025 |
10.41 (0.58%) |
10.37 |
10.34 - 10.41 |
1.4965 times |
Mon 01 December 2025 |
10.35 (-0.48%) |
10.36 |
10.34 - 10.40 |
1.2757 times |
Fri 28 November 2025 |
10.40 (0.19%) |
10.38 |
10.38 - 10.47 |
0.7734 times |
Wed 26 November 2025 |
10.38 (-0.19%) |
10.39 |
10.37 - 10.40 |
0.6404 times |
Tue 25 November 2025 |
10.40 (0.29%) |
10.38 |
10.35 - 10.42 |
1.0541 times |
Mon 24 November 2025 |
10.37 (0.19%) |
10.35 |
10.35 - 10.40 |
0.6441 times |
Fri 21 November 2025 |
10.35 (0.19%) |
10.33 |
10.32 - 10.40 |
0.9728 times |
Thu 20 November 2025 |
10.33 (-0.77%) |
10.44 |
10.33 - 10.48 |
0.865 times |
Wed 19 November 2025 |
10.41 (-0.67%) |
10.44 |
10.41 - 10.53 |
1.0061 times |
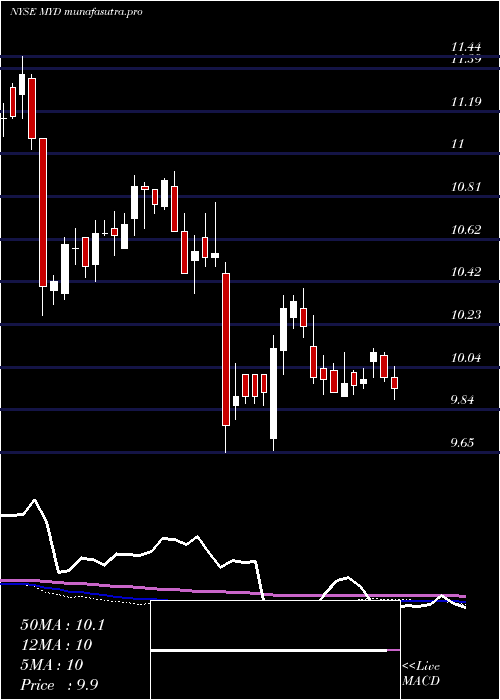
Weekly price and charts BlackrockMuniyield Strong weekly Stock price targets for BlackrockMuniyield MYD are 10.42 and 10.62 | Weekly Target 1 | 10.26 | | Weekly Target 2 | 10.38 | | Weekly Target 3 | 10.46 | | Weekly Target 4 | 10.58 | | Weekly Target 5 | 10.66 |
Weekly price and volumes for Blackrock Muniyield
| Date |
Closing |
Open |
Range |
Volume |
Thu 04 December 2025 |
10.50 (0.96%) |
10.36 |
10.34 - 10.54 |
1.3432 times |
Fri 28 November 2025 |
10.40 (0.48%) |
10.35 |
10.35 - 10.47 |
0.8277 times |
Fri 21 November 2025 |
10.35 (-1.8%) |
10.57 |
10.32 - 10.59 |
1.2988 times |
Fri 14 November 2025 |
10.54 (-0.38%) |
10.59 |
10.54 - 10.67 |
0.846 times |
Fri 07 November 2025 |
10.58 (0.09%) |
10.54 |
10.51 - 10.67 |
1.1018 times |
Fri 31 October 2025 |
10.57 (0%) |
10.53 |
10.50 - 10.60 |
0.3018 times |
Fri 31 October 2025 |
10.57 (-0.19%) |
10.59 |
10.50 - 10.67 |
1.8281 times |
Fri 24 October 2025 |
10.59 (0.19%) |
10.59 |
10.57 - 10.69 |
0.9481 times |
Fri 17 October 2025 |
10.57 (-0.28%) |
10.69 |
10.57 - 10.73 |
0.9762 times |
Tue 07 October 2025 |
10.60 (0.86%) |
10.49 |
10.49 - 10.64 |
0.5282 times |
Fri 03 October 2025 |
10.51 (0.1%) |
10.53 |
10.50 - 10.65 |
1.4656 times |
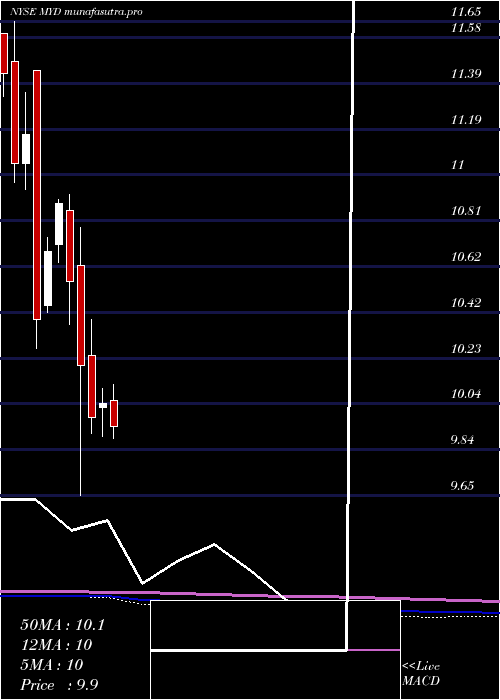
Monthly price and charts BlackrockMuniyield Strong monthly Stock price targets for BlackrockMuniyield MYD are 10.42 and 10.62 | Monthly Target 1 | 10.26 | | Monthly Target 2 | 10.38 | | Monthly Target 3 | 10.46 | | Monthly Target 4 | 10.58 | | Monthly Target 5 | 10.66 |
Monthly price and volumes Blackrock Muniyield
| Date |
Closing |
Open |
Range |
Volume |
Thu 04 December 2025 |
10.50 (0.96%) |
10.36 |
10.34 - 10.54 |
0.3039 times |
Fri 28 November 2025 |
10.40 (-1.61%) |
10.54 |
10.32 - 10.67 |
0.9219 times |
Fri 31 October 2025 |
10.57 (0.09%) |
10.57 |
10.49 - 10.73 |
1.2604 times |
Tue 30 September 2025 |
10.56 (4.97%) |
10.02 |
9.98 - 10.69 |
0.8957 times |
Fri 29 August 2025 |
10.06 (1.51%) |
9.93 |
9.91 - 10.18 |
0.8855 times |
Thu 31 July 2025 |
9.91 (-1.29%) |
10.05 |
9.77 - 10.12 |
1.3819 times |
Mon 30 June 2025 |
10.04 (0.6%) |
10.02 |
9.90 - 10.10 |
0.9137 times |
Fri 30 May 2025 |
9.98 (-2.16%) |
10.24 |
9.91 - 10.39 |
0.9853 times |
Wed 30 April 2025 |
10.20 (-3.32%) |
10.62 |
9.65 - 10.78 |
1.4865 times |
Mon 31 March 2025 |
10.55 (-3.03%) |
10.85 |
10.37 - 10.92 |
0.9652 times |
Fri 28 February 2025 |
10.88 (1.87%) |
10.71 |
10.63 - 10.90 |
0.9205 times |
DMA SMA EMA moving averages of Blackrock Muniyield MYD
DMA (daily moving average) of Blackrock Muniyield MYD
| DMA period | DMA value | | 5 day DMA | 10.43 | | 12 day DMA | 10.41 | | 20 day DMA | 10.47 | | 35 day DMA | 10.52 | | 50 day DMA | 10.54 | | 100 day DMA | 10.32 | | 150 day DMA | 10.24 | | 200 day DMA | 10.29 | EMA (exponential moving average) of Blackrock Muniyield MYD
| EMA period | EMA current | EMA prev | EMA prev2 | | 5 day EMA | 10.45 | 10.42 | 10.39 | | 12 day EMA | 10.45 | 10.44 | 10.43 | | 20 day EMA | 10.46 | 10.46 | 10.46 | | 35 day EMA | 10.49 | 10.49 | 10.49 | | 50 day EMA | 10.53 | 10.53 | 10.53 |
SMA (simple moving average) of Blackrock Muniyield MYD
| SMA period | SMA current | SMA prev | SMA prev2 | | 5 day SMA | 10.43 | 10.4 | 10.39 | | 12 day SMA | 10.41 | 10.41 | 10.41 | | 20 day SMA | 10.47 | 10.47 | 10.48 | | 35 day SMA | 10.52 | 10.53 | 10.54 | | 50 day SMA | 10.54 | 10.55 | 10.55 | | 100 day SMA | 10.32 | 10.32 | 10.31 | | 150 day SMA | 10.24 | 10.24 | 10.23 | | 200 day SMA | 10.29 | 10.29 | 10.29 |
|
|
