MagnachipSemiconductor MX full analysis,charts,indicators,moving averages,SMA,DMA,EMA,ADX,MACD,RSIMagnachip Semiconductor MX WideScreen charts, DMA,SMA,EMA technical analysis, forecast prediction, by indicators ADX,MACD,RSI,CCI NYSE stock exchange
operates under Technology sector & deals in Semiconductors
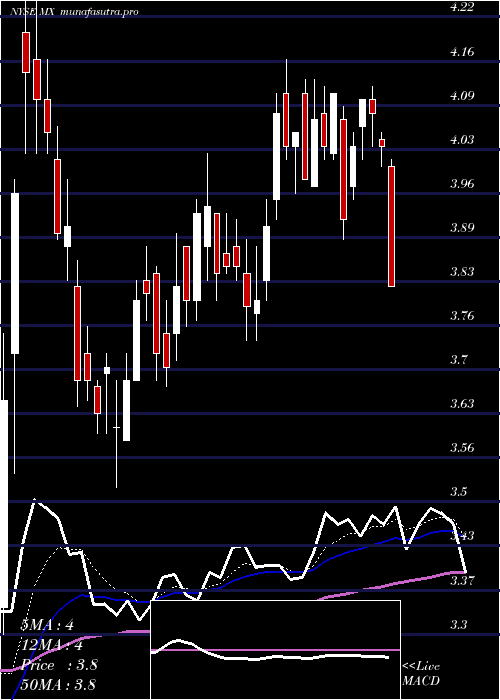
Daily price and charts and targets MagnachipSemiconductor Strong Daily Stock price targets for MagnachipSemiconductor MX are 2.94 and 3.07 | Daily Target 1 | 2.85 | | Daily Target 2 | 2.92 | | Daily Target 3 | 2.9766666666667 | | Daily Target 4 | 3.05 | | Daily Target 5 | 3.11 |
Daily price and volume Magnachip Semiconductor
| Date |
Closing |
Open |
Range |
Volume |
Thu 04 December 2025 |
3.00 (1.35%) |
3.00 |
2.90 - 3.03 |
1.1363 times |
Wed 03 December 2025 |
2.96 (5.34%) |
2.82 |
2.79 - 2.96 |
0.9107 times |
Tue 02 December 2025 |
2.81 (3.69%) |
2.74 |
2.70 - 2.82 |
0.6592 times |
Mon 01 December 2025 |
2.71 (2.65%) |
2.62 |
2.61 - 2.72 |
0.6138 times |
Fri 28 November 2025 |
2.64 (-0.38%) |
2.66 |
2.60 - 2.68 |
0.5447 times |
Wed 26 November 2025 |
2.65 (11.34%) |
2.40 |
2.40 - 2.67 |
1.3507 times |
Tue 25 November 2025 |
2.38 (-0.42%) |
2.42 |
2.32 - 2.42 |
0.5516 times |
Mon 24 November 2025 |
2.39 (3.91%) |
2.32 |
2.25 - 2.41 |
2.2091 times |
Fri 21 November 2025 |
2.30 (1.32%) |
2.30 |
2.19 - 2.32 |
0.8401 times |
Thu 20 November 2025 |
2.27 (-2.16%) |
2.35 |
2.22 - 2.43 |
1.1837 times |
Wed 19 November 2025 |
2.32 (0.87%) |
2.30 |
2.27 - 2.35 |
0.9405 times |
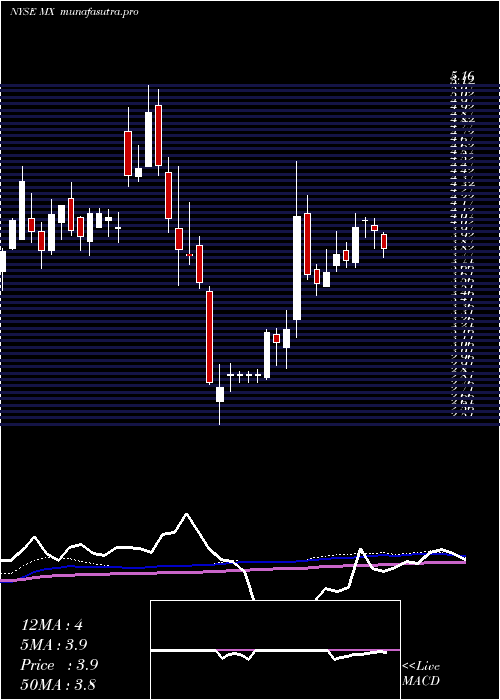
Weekly price and charts MagnachipSemiconductor Strong weekly Stock price targets for MagnachipSemiconductor MX are 2.81 and 3.23 | Weekly Target 1 | 2.46 | | Weekly Target 2 | 2.73 | | Weekly Target 3 | 2.88 | | Weekly Target 4 | 3.15 | | Weekly Target 5 | 3.3 |
Weekly price and volumes for Magnachip Semiconductor
| Date |
Closing |
Open |
Range |
Volume |
Thu 04 December 2025 |
3.00 (13.64%) |
2.62 |
2.61 - 3.03 |
1.1573 times |
Fri 28 November 2025 |
2.64 (14.78%) |
2.32 |
2.25 - 2.68 |
1.6231 times |
Fri 21 November 2025 |
2.30 (-1.29%) |
2.35 |
2.18 - 2.44 |
1.6145 times |
Fri 14 November 2025 |
2.33 (2.64%) |
2.28 |
2.21 - 2.45 |
1.1747 times |
Fri 07 November 2025 |
2.27 (-26.77%) |
2.76 |
2.21 - 2.89 |
1.7211 times |
Fri 31 October 2025 |
3.10 (0%) |
3.00 |
3.00 - 3.12 |
0.1319 times |
Fri 31 October 2025 |
3.10 (0.98%) |
3.12 |
2.95 - 3.18 |
0.7933 times |
Fri 24 October 2025 |
3.07 (1.99%) |
3.04 |
2.96 - 3.15 |
0.8371 times |
Fri 17 October 2025 |
3.01 (0.33%) |
3.05 |
2.98 - 3.23 |
0.413 times |
Fri 10 October 2025 |
3.00 (-6.25%) |
3.23 |
2.98 - 3.29 |
0.5339 times |
Fri 03 October 2025 |
3.20 (-1.54%) |
3.27 |
3.12 - 3.30 |
0.686 times |
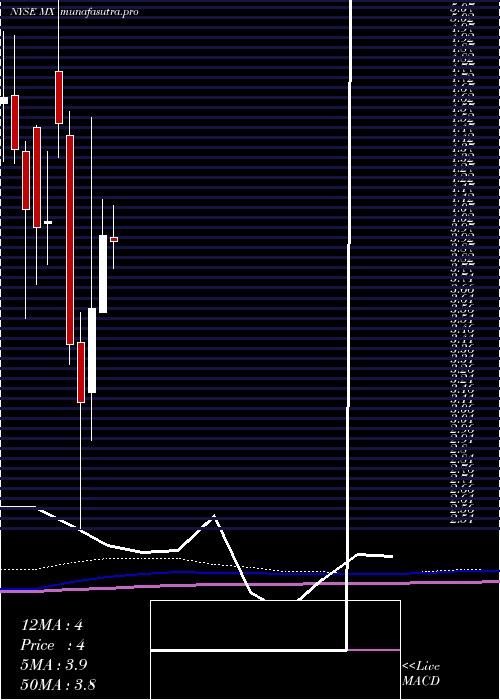
Monthly price and charts MagnachipSemiconductor Strong monthly Stock price targets for MagnachipSemiconductor MX are 2.81 and 3.23 | Monthly Target 1 | 2.46 | | Monthly Target 2 | 2.73 | | Monthly Target 3 | 2.88 | | Monthly Target 4 | 3.15 | | Monthly Target 5 | 3.3 |
Monthly price and volumes Magnachip Semiconductor
| Date |
Closing |
Open |
Range |
Volume |
Thu 04 December 2025 |
3.00 (13.64%) |
2.62 |
2.61 - 3.03 |
0.3761 times |
Fri 28 November 2025 |
2.64 (-14.84%) |
2.76 |
2.18 - 2.89 |
1.9933 times |
Fri 31 October 2025 |
3.10 (-0.96%) |
3.12 |
2.95 - 3.30 |
0.9603 times |
Tue 30 September 2025 |
3.13 (-0.63%) |
3.10 |
2.89 - 3.36 |
0.8703 times |
Fri 29 August 2025 |
3.15 (-23.17%) |
3.15 |
2.66 - 3.30 |
1.5445 times |
Thu 31 July 2025 |
4.10 (3.02%) |
3.97 |
3.81 - 4.50 |
0.6142 times |
Mon 30 June 2025 |
3.98 (10.25%) |
3.59 |
3.59 - 4.16 |
0.5361 times |
Fri 30 May 2025 |
3.61 (14.97%) |
3.19 |
2.95 - 4.57 |
1.2925 times |
Wed 30 April 2025 |
3.14 (-8.45%) |
3.44 |
2.51 - 3.59 |
0.8416 times |
Mon 31 March 2025 |
3.43 (-24.45%) |
4.48 |
3.33 - 4.60 |
0.9712 times |
Fri 28 February 2025 |
4.54 (12.1%) |
4.80 |
4.37 - 5.16 |
0.918 times |
DMA SMA EMA moving averages of Magnachip Semiconductor MX
DMA (daily moving average) of Magnachip Semiconductor MX
| DMA period | DMA value | | 5 day DMA | 2.82 | | 12 day DMA | 2.56 | | 20 day DMA | 2.47 | | 35 day DMA | 2.7 | | 50 day DMA | 2.84 | | 100 day DMA | 3.06 | | 150 day DMA | 3.29 | | 200 day DMA | 3.39 | EMA (exponential moving average) of Magnachip Semiconductor MX
| EMA period | EMA current | EMA prev | EMA prev2 | | 5 day EMA | 2.84 | 2.76 | 2.66 | | 12 day EMA | 2.68 | 2.62 | 2.56 | | 20 day EMA | 2.65 | 2.61 | 2.57 | | 35 day EMA | 2.73 | 2.71 | 2.69 | | 50 day EMA | 2.87 | 2.86 | 2.86 |
SMA (simple moving average) of Magnachip Semiconductor MX
| SMA period | SMA current | SMA prev | SMA prev2 | | 5 day SMA | 2.82 | 2.75 | 2.64 | | 12 day SMA | 2.56 | 2.51 | 2.45 | | 20 day SMA | 2.47 | 2.45 | 2.45 | | 35 day SMA | 2.7 | 2.71 | 2.71 | | 50 day SMA | 2.84 | 2.84 | 2.85 | | 100 day SMA | 3.06 | 3.07 | 3.08 | | 150 day SMA | 3.29 | 3.29 | 3.3 | | 200 day SMA | 3.39 | 3.39 | 3.4 |
|
|
