MvOil MVO full analysis,charts,indicators,moving averages,SMA,DMA,EMA,ADX,MACD,RSIMv Oil MVO WideScreen charts, DMA,SMA,EMA technical analysis, forecast prediction, by indicators ADX,MACD,RSI,CCI NYSE stock exchange
operates under Energy sector & deals in Oil Gas Production
Daily price and charts and targets MvOil Strong Daily Stock price targets for MvOil MVO are 1.42 and 1.6 | Daily Target 1 | 1.29 | | Daily Target 2 | 1.37 | | Daily Target 3 | 1.4666666666667 | | Daily Target 4 | 1.55 | | Daily Target 5 | 1.65 |
Daily price and volume Mv Oil
| Date |
Closing |
Open |
Range |
Volume |
Fri 05 December 2025 |
1.46 (8.96%) |
1.42 |
1.38 - 1.56 |
1.8571 times |
Thu 04 December 2025 |
1.34 (16.52%) |
1.15 |
1.13 - 1.41 |
1.6674 times |
Wed 03 December 2025 |
1.15 (10.58%) |
1.05 |
1.04 - 1.15 |
0.9926 times |
Tue 02 December 2025 |
1.04 (-1.89%) |
1.10 |
1.04 - 1.10 |
0.4357 times |
Mon 01 December 2025 |
1.06 (-2.75%) |
1.06 |
1.05 - 1.10 |
0.6137 times |
Fri 28 November 2025 |
1.09 (0.93%) |
1.10 |
1.04 - 1.11 |
0.2606 times |
Wed 26 November 2025 |
1.08 (3.85%) |
1.07 |
1.05 - 1.14 |
0.7685 times |
Tue 25 November 2025 |
1.04 (0%) |
1.02 |
1.00 - 1.07 |
0.4443 times |
Mon 24 November 2025 |
1.04 (-7.96%) |
1.16 |
1.02 - 1.16 |
1.1379 times |
Fri 21 November 2025 |
1.13 (10.78%) |
1.01 |
0.97 - 1.20 |
1.8222 times |
Thu 20 November 2025 |
1.02 (-18.4%) |
1.18 |
1.01 - 1.20 |
1.9789 times |
Weekly price and charts MvOil Strong weekly Stock price targets for MvOil MVO are 1.25 and 1.77 | Weekly Target 1 | 0.83 | | Weekly Target 2 | 1.15 | | Weekly Target 3 | 1.3533333333333 | | Weekly Target 4 | 1.67 | | Weekly Target 5 | 1.87 |
Weekly price and volumes for Mv Oil
| Date |
Closing |
Open |
Range |
Volume |
Fri 05 December 2025 |
1.46 (33.94%) |
1.06 |
1.04 - 1.56 |
1.754 times |
Fri 28 November 2025 |
1.09 (-3.54%) |
1.16 |
1.00 - 1.16 |
0.8228 times |
Fri 21 November 2025 |
1.13 (-71.82%) |
4.02 |
0.97 - 4.07 |
4.5492 times |
Fri 14 November 2025 |
4.01 (-8.86%) |
4.39 |
4.01 - 4.50 |
0.4276 times |
Fri 07 November 2025 |
4.40 (-6.38%) |
4.74 |
4.30 - 4.78 |
0.2846 times |
Fri 31 October 2025 |
4.70 (0%) |
4.70 |
4.60 - 4.77 |
0.12 times |
Fri 31 October 2025 |
4.70 (-9.62%) |
5.22 |
4.60 - 5.29 |
0.6678 times |
Fri 24 October 2025 |
5.20 (-1.89%) |
5.45 |
4.93 - 5.45 |
0.5282 times |
Fri 17 October 2025 |
5.30 (-11.07%) |
5.95 |
5.29 - 6.03 |
0.6986 times |
Tue 07 October 2025 |
5.96 (2.41%) |
6.04 |
5.83 - 6.04 |
0.147 times |
Fri 03 October 2025 |
5.82 (-4.75%) |
6.05 |
5.57 - 6.08 |
0.352 times |
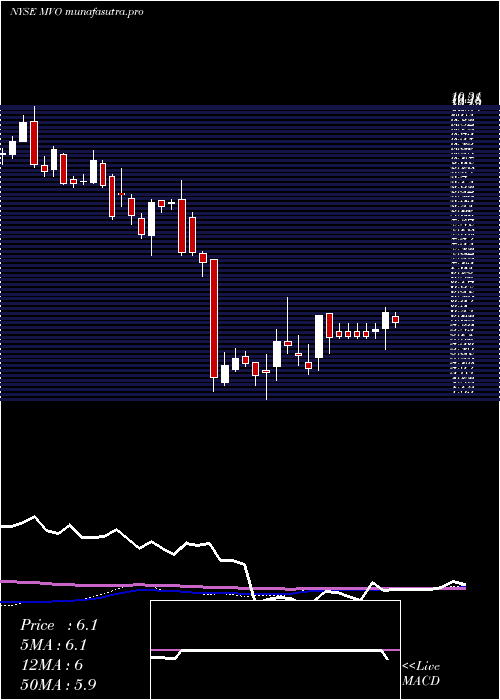
Monthly price and charts MvOil Strong monthly Stock price targets for MvOil MVO are 1.25 and 1.77 | Monthly Target 1 | 0.83 | | Monthly Target 2 | 1.15 | | Monthly Target 3 | 1.3533333333333 | | Monthly Target 4 | 1.67 | | Monthly Target 5 | 1.87 |
Monthly price and volumes Mv Oil
| Date |
Closing |
Open |
Range |
Volume |
Fri 05 December 2025 |
1.46 (33.94%) |
1.06 |
1.04 - 1.56 |
0.8034 times |
Fri 28 November 2025 |
1.09 (-76.81%) |
4.74 |
0.97 - 4.78 |
2.7869 times |
Fri 31 October 2025 |
4.70 (-16.37%) |
5.65 |
4.60 - 6.04 |
1.0624 times |
Tue 30 September 2025 |
5.62 (-6.64%) |
6.00 |
5.57 - 6.19 |
0.5269 times |
Fri 29 August 2025 |
6.02 (7.5%) |
5.75 |
5.55 - 6.08 |
0.4669 times |
Thu 31 July 2025 |
5.60 (-2.78%) |
5.80 |
5.53 - 6.14 |
1.1597 times |
Mon 30 June 2025 |
5.76 (-0.52%) |
5.80 |
5.50 - 6.26 |
0.632 times |
Fri 30 May 2025 |
5.79 (-1.19%) |
5.92 |
5.57 - 6.04 |
0.4945 times |
Wed 30 April 2025 |
5.86 (8.52%) |
5.46 |
5.10 - 6.40 |
1.1063 times |
Mon 31 March 2025 |
5.40 (6.3%) |
5.19 |
4.63 - 6.60 |
0.9609 times |
Fri 28 February 2025 |
5.08 (0.59%) |
4.96 |
4.90 - 5.62 |
0.8176 times |

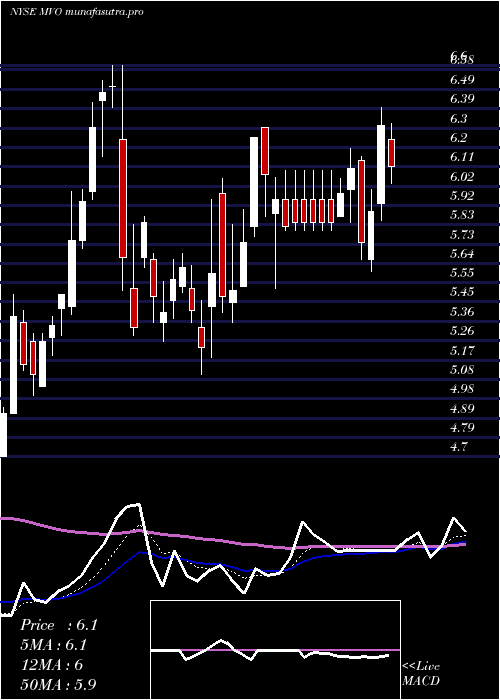
DMA SMA EMA moving averages of Mv Oil MVO
DMA (daily moving average) of Mv Oil MVO
| DMA period | DMA value | | 5 day DMA | 1.21 | | 12 day DMA | 1.14 | | 20 day DMA | 2.19 | | 35 day DMA | 3.37 | | 50 day DMA | 4.12 | | 100 day DMA | 5 | | 150 day DMA | 5.27 | | 200 day DMA | 5.35 | EMA (exponential moving average) of Mv Oil MVO
| EMA period | EMA current | EMA prev | EMA prev2 | | 5 day EMA | 1.28 | 1.19 | 1.12 | | 12 day EMA | 1.54 | 1.56 | 1.6 | | 20 day EMA | 2.09 | 2.16 | 2.25 | | 35 day EMA | 3 | 3.09 | 3.19 | | 50 day EMA | 4 | 4.1 | 4.21 |
SMA (simple moving average) of Mv Oil MVO
| SMA period | SMA current | SMA prev | SMA prev2 | | 5 day SMA | 1.21 | 1.14 | 1.08 | | 12 day SMA | 1.14 | 1.16 | 1.27 | | 20 day SMA | 2.19 | 2.34 | 2.5 | | 35 day SMA | 3.37 | 3.49 | 3.61 | | 50 day SMA | 4.12 | 4.21 | 4.3 | | 100 day SMA | 5 | 5.04 | 5.09 | | 150 day SMA | 5.27 | 5.3 | 5.33 | | 200 day SMA | 5.35 | 5.37 | 5.39 |
|
|
