BlackrockMuniholdings MUJ full analysis,charts,indicators,moving averages,SMA,DMA,EMA,ADX,MACD,RSIBlackrock Muniholdings MUJ WideScreen charts, DMA,SMA,EMA technical analysis, forecast prediction, by indicators ADX,MACD,RSI,CCI NYSE stock exchange
operates under N A sector & deals in N A
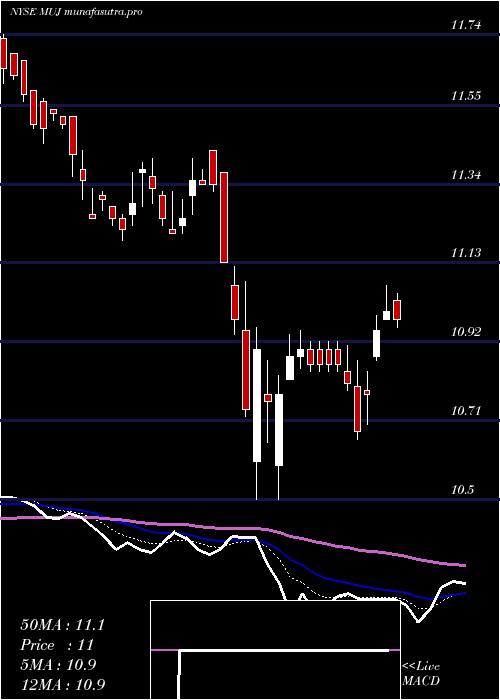
Daily price and charts and targets BlackrockMuniholdings Strong Daily Stock price targets for BlackrockMuniholdings MUJ are 12.09 and 12.2 | Daily Target 1 | 12 | | Daily Target 2 | 12.06 | | Daily Target 3 | 12.106666666667 | | Daily Target 4 | 12.17 | | Daily Target 5 | 12.22 |
Daily price and volume Blackrock Muniholdings
| Date |
Closing |
Open |
Range |
Volume |
Fri 05 December 2025 |
12.13 (0.92%) |
12.08 |
12.04 - 12.15 |
1.8127 times |
Thu 04 December 2025 |
12.02 (0.17%) |
12.00 |
11.96 - 12.07 |
0.871 times |
Wed 03 December 2025 |
12.00 (0.59%) |
11.96 |
11.95 - 12.05 |
1.2442 times |
Tue 02 December 2025 |
11.93 (0.68%) |
11.86 |
11.83 - 11.95 |
1.1009 times |
Mon 01 December 2025 |
11.85 (-0.34%) |
11.88 |
11.84 - 11.90 |
0.9063 times |
Fri 28 November 2025 |
11.89 (0.08%) |
11.87 |
11.85 - 11.90 |
0.3775 times |
Wed 26 November 2025 |
11.88 (-0.08%) |
11.88 |
11.83 - 11.90 |
0.6722 times |
Tue 25 November 2025 |
11.89 (1.54%) |
11.76 |
11.75 - 11.95 |
1.3876 times |
Mon 24 November 2025 |
11.71 (0.26%) |
11.71 |
11.66 - 11.72 |
1.0865 times |
Fri 21 November 2025 |
11.68 (0%) |
11.72 |
11.66 - 11.72 |
0.5411 times |
Thu 20 November 2025 |
11.68 (0.09%) |
11.74 |
11.65 - 11.74 |
0.4813 times |
Weekly price and charts BlackrockMuniholdings Strong weekly Stock price targets for BlackrockMuniholdings MUJ are 11.98 and 12.3 | Weekly Target 1 | 11.72 | | Weekly Target 2 | 11.92 | | Weekly Target 3 | 12.036666666667 | | Weekly Target 4 | 12.24 | | Weekly Target 5 | 12.36 |
Weekly price and volumes for Blackrock Muniholdings
| Date |
Closing |
Open |
Range |
Volume |
Fri 05 December 2025 |
12.13 (2.02%) |
11.88 |
11.83 - 12.15 |
1.8317 times |
Fri 28 November 2025 |
11.89 (1.8%) |
11.71 |
11.66 - 11.95 |
1.0875 times |
Fri 21 November 2025 |
11.68 (-1.1%) |
11.81 |
11.62 - 11.81 |
1.369 times |
Fri 14 November 2025 |
11.81 (0.17%) |
11.78 |
11.74 - 11.95 |
0.9054 times |
Fri 07 November 2025 |
11.79 (0.51%) |
11.77 |
11.74 - 11.92 |
0.6357 times |
Fri 31 October 2025 |
11.73 (0%) |
11.67 |
11.67 - 11.77 |
0.2001 times |
Fri 31 October 2025 |
11.73 (0.95%) |
11.62 |
11.59 - 11.77 |
1.204 times |
Fri 24 October 2025 |
11.62 (0.96%) |
11.52 |
11.52 - 11.66 |
0.8809 times |
Fri 17 October 2025 |
11.51 (-1.2%) |
11.65 |
11.50 - 11.71 |
1.1953 times |
Tue 07 October 2025 |
11.65 (0.09%) |
11.55 |
11.52 - 11.67 |
0.6905 times |
Fri 03 October 2025 |
11.64 (1.57%) |
11.42 |
11.42 - 11.69 |
1.5021 times |
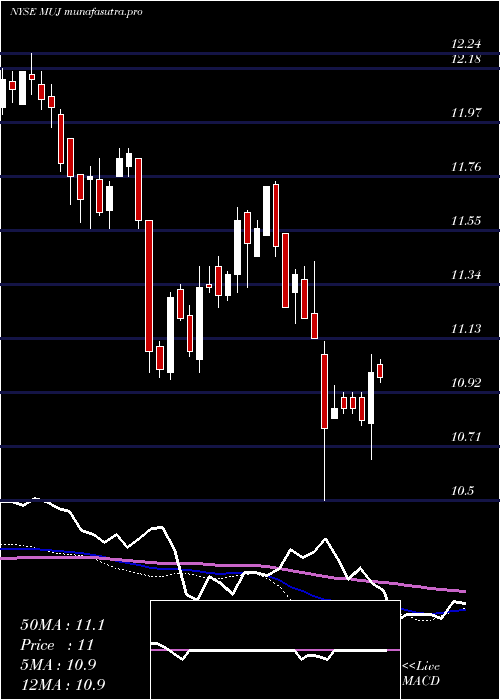
Monthly price and charts BlackrockMuniholdings Strong monthly Stock price targets for BlackrockMuniholdings MUJ are 11.98 and 12.3 | Monthly Target 1 | 11.72 | | Monthly Target 2 | 11.92 | | Monthly Target 3 | 12.036666666667 | | Monthly Target 4 | 12.24 | | Monthly Target 5 | 12.36 |
Monthly price and volumes Blackrock Muniholdings
| Date |
Closing |
Open |
Range |
Volume |
Fri 05 December 2025 |
12.13 (2.02%) |
11.88 |
11.83 - 12.15 |
0.3872 times |
Fri 28 November 2025 |
11.89 (1.36%) |
11.77 |
11.62 - 11.95 |
0.8449 times |
Fri 31 October 2025 |
11.73 (1.21%) |
11.59 |
11.49 - 11.77 |
1.1303 times |
Tue 30 September 2025 |
11.59 (4.79%) |
11.04 |
10.88 - 11.59 |
1.4213 times |
Fri 29 August 2025 |
11.06 (2.22%) |
10.83 |
10.81 - 11.13 |
0.9952 times |
Thu 31 July 2025 |
10.82 (-1.19%) |
10.97 |
10.66 - 11.11 |
1.2806 times |
Mon 30 June 2025 |
10.95 (0.27%) |
10.95 |
10.73 - 10.97 |
1.0321 times |
Fri 30 May 2025 |
10.92 (-1.8%) |
11.19 |
10.78 - 11.20 |
0.9243 times |
Wed 30 April 2025 |
11.12 (-1.16%) |
11.31 |
10.50 - 11.43 |
1.3029 times |
Mon 31 March 2025 |
11.25 (-4.01%) |
11.73 |
11.19 - 11.74 |
0.6811 times |
Fri 28 February 2025 |
11.72 (2.99%) |
11.38 |
11.31 - 11.72 |
0.7838 times |

DMA SMA EMA moving averages of Blackrock Muniholdings MUJ
DMA (daily moving average) of Blackrock Muniholdings MUJ
| DMA period | DMA value | | 5 day DMA | 11.99 | | 12 day DMA | 11.86 | | 20 day DMA | 11.84 | | 35 day DMA | 11.76 | | 50 day DMA | 11.7 | | 100 day DMA | 11.36 | | 150 day DMA | 11.22 | | 200 day DMA | 11.23 | EMA (exponential moving average) of Blackrock Muniholdings MUJ
| EMA period | EMA current | EMA prev | EMA prev2 | | 5 day EMA | 12.01 | 11.95 | 11.91 | | 12 day EMA | 11.92 | 11.88 | 11.85 | | 20 day EMA | 11.86 | 11.83 | 11.81 | | 35 day EMA | 11.78 | 11.76 | 11.74 | | 50 day EMA | 11.71 | 11.69 | 11.68 |
SMA (simple moving average) of Blackrock Muniholdings MUJ
| SMA period | SMA current | SMA prev | SMA prev2 | | 5 day SMA | 11.99 | 11.94 | 11.91 | | 12 day SMA | 11.86 | 11.82 | 11.8 | | 20 day SMA | 11.84 | 11.83 | 11.82 | | 35 day SMA | 11.76 | 11.75 | 11.74 | | 50 day SMA | 11.7 | 11.69 | 11.67 | | 100 day SMA | 11.36 | 11.35 | 11.34 | | 150 day SMA | 11.22 | 11.22 | 11.21 | | 200 day SMA | 11.23 | 11.22 | 11.22 |
|
|
