BlackrockMuniholdings MUE full analysis,charts,indicators,moving averages,SMA,DMA,EMA,ADX,MACD,RSIBlackrock Muniholdings MUE WideScreen charts, DMA,SMA,EMA technical analysis, forecast prediction, by indicators ADX,MACD,RSI,CCI NYSE stock exchange
operates under N A sector & deals in N A
Daily price and charts and targets BlackrockMuniholdings Strong Daily Stock price targets for BlackrockMuniholdings MUE are 10.04 and 10.13 | Daily Target 1 | 9.97 | | Daily Target 2 | 10.02 | | Daily Target 3 | 10.063333333333 | | Daily Target 4 | 10.11 | | Daily Target 5 | 10.15 |
Daily price and volume Blackrock Muniholdings
| Date |
Closing |
Open |
Range |
Volume |
Fri 05 December 2025 |
10.06 (0.1%) |
10.02 |
10.02 - 10.11 |
1.0821 times |
Thu 04 December 2025 |
10.05 (0.1%) |
10.01 |
9.99 - 10.07 |
0.5535 times |
Wed 03 December 2025 |
10.04 (1.01%) |
9.94 |
9.94 - 10.04 |
2.1015 times |
Tue 02 December 2025 |
9.94 (-0.3%) |
9.93 |
9.91 - 9.98 |
0.4852 times |
Mon 01 December 2025 |
9.97 (0%) |
9.95 |
9.93 - 9.99 |
0.848 times |
Fri 28 November 2025 |
9.97 (0%) |
9.94 |
9.93 - 9.98 |
0.325 times |
Wed 26 November 2025 |
9.97 (0.1%) |
9.95 |
9.94 - 9.99 |
0.8086 times |
Tue 25 November 2025 |
9.96 (0.4%) |
9.92 |
9.92 - 9.97 |
2.1748 times |
Mon 24 November 2025 |
9.92 (0.2%) |
9.91 |
9.91 - 9.95 |
0.663 times |
Fri 21 November 2025 |
9.90 (-0.5%) |
9.91 |
9.88 - 9.94 |
0.9582 times |
Thu 20 November 2025 |
9.95 (-0.1%) |
10.01 |
9.90 - 10.01 |
0.4634 times |
Weekly price and charts BlackrockMuniholdings Strong weekly Stock price targets for BlackrockMuniholdings MUE are 9.99 and 10.19 | Weekly Target 1 | 9.83 | | Weekly Target 2 | 9.94 | | Weekly Target 3 | 10.026666666667 | | Weekly Target 4 | 10.14 | | Weekly Target 5 | 10.23 |
Weekly price and volumes for Blackrock Muniholdings
| Date |
Closing |
Open |
Range |
Volume |
Fri 05 December 2025 |
10.06 (0.9%) |
9.95 |
9.91 - 10.11 |
1.6422 times |
Fri 28 November 2025 |
9.97 (0.71%) |
9.91 |
9.91 - 9.99 |
1.2862 times |
Fri 21 November 2025 |
9.90 (-1.39%) |
10.06 |
9.88 - 10.07 |
1.2253 times |
Fri 14 November 2025 |
10.04 (0.1%) |
10.05 |
9.99 - 10.20 |
0.9313 times |
Fri 07 November 2025 |
10.03 (-0.79%) |
10.04 |
10.00 - 10.13 |
0.7705 times |
Fri 31 October 2025 |
10.11 (0%) |
10.05 |
10.02 - 10.14 |
0.2311 times |
Fri 31 October 2025 |
10.11 (-0.3%) |
10.14 |
10.02 - 10.15 |
1.0937 times |
Fri 24 October 2025 |
10.14 (0.6%) |
10.09 |
10.05 - 10.16 |
0.7781 times |
Fri 17 October 2025 |
10.08 (0.8%) |
10.06 |
10.00 - 10.12 |
1.1864 times |
Tue 07 October 2025 |
10.00 (0.4%) |
9.96 |
9.87 - 10.02 |
0.855 times |
Fri 03 October 2025 |
9.96 (-0.4%) |
10.05 |
9.95 - 10.13 |
0.7042 times |
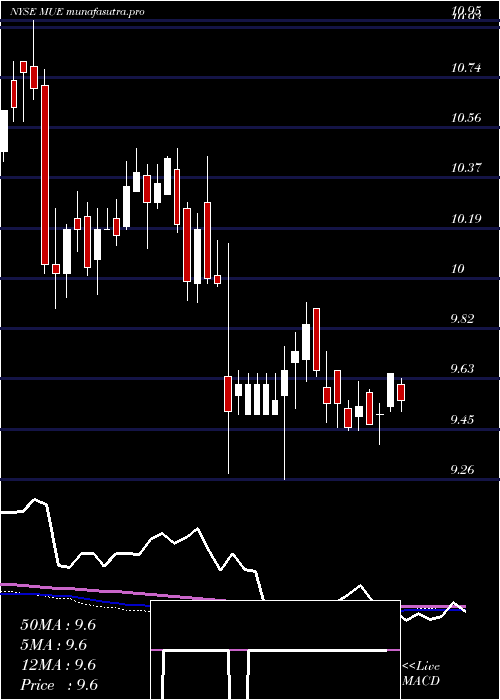
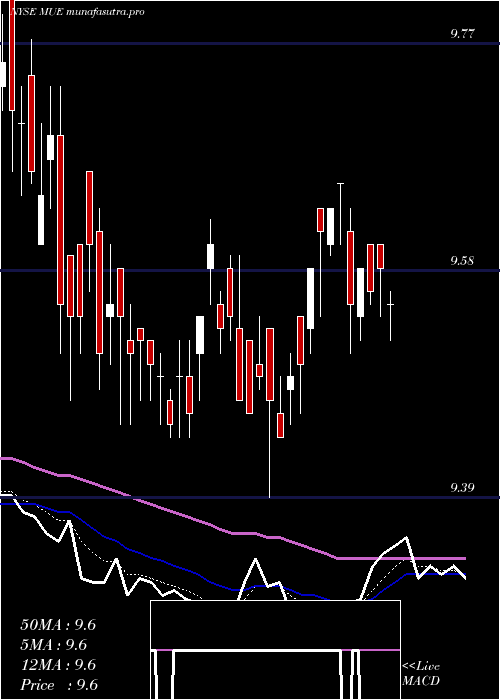
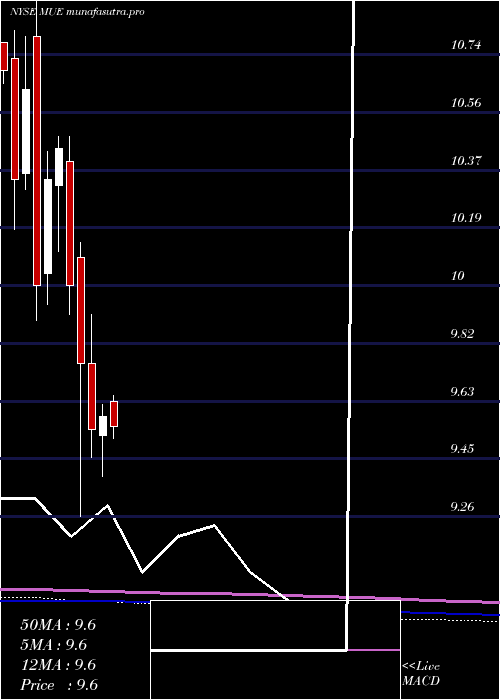
Monthly price and charts BlackrockMuniholdings Strong monthly Stock price targets for BlackrockMuniholdings MUE are 9.99 and 10.19 | Monthly Target 1 | 9.83 | | Monthly Target 2 | 9.94 | | Monthly Target 3 | 10.026666666667 | | Monthly Target 4 | 10.14 | | Monthly Target 5 | 10.23 |
Monthly price and volumes Blackrock Muniholdings
| Date |
Closing |
Open |
Range |
Volume |
Fri 05 December 2025 |
10.06 (0.9%) |
9.95 |
9.91 - 10.11 |
0.4521 times |
Fri 28 November 2025 |
9.97 (-1.38%) |
10.04 |
9.88 - 10.20 |
1.1599 times |
Fri 31 October 2025 |
10.11 (0.5%) |
10.06 |
9.87 - 10.16 |
1.2715 times |
Tue 30 September 2025 |
10.06 (5.45%) |
9.50 |
9.45 - 10.11 |
0.8747 times |
Fri 29 August 2025 |
9.54 (1.49%) |
9.43 |
9.37 - 9.64 |
1.2348 times |
Thu 31 July 2025 |
9.40 (-1.88%) |
9.63 |
9.27 - 9.65 |
0.9667 times |
Mon 30 June 2025 |
9.58 (0.42%) |
9.52 |
9.39 - 9.62 |
1.1464 times |
Fri 30 May 2025 |
9.54 (-2.15%) |
9.75 |
9.45 - 9.91 |
1.0123 times |
Wed 30 April 2025 |
9.75 (-2.5%) |
10.09 |
9.26 - 10.14 |
1.1884 times |
Mon 31 March 2025 |
10.00 (-4.21%) |
10.40 |
9.91 - 10.48 |
0.6933 times |
Fri 28 February 2025 |
10.44 (0.97%) |
10.32 |
10.11 - 10.48 |
0.7141 times |
DMA SMA EMA moving averages of Blackrock Muniholdings MUE
DMA (daily moving average) of Blackrock Muniholdings MUE
| DMA period | DMA value | | 5 day DMA | 10.01 | | 12 day DMA | 9.97 | | 20 day DMA | 10.01 | | 35 day DMA | 10.05 | | 50 day DMA | 10.04 | | 100 day DMA | 9.81 | | 150 day DMA | 9.74 | | 200 day DMA | 9.79 | EMA (exponential moving average) of Blackrock Muniholdings MUE
| EMA period | EMA current | EMA prev | EMA prev2 | | 5 day EMA | 10.02 | 10 | 9.98 | | 12 day EMA | 10.01 | 10 | 9.99 | | 20 day EMA | 10.01 | 10 | 10 | | 35 day EMA | 10.02 | 10.02 | 10.02 | | 50 day EMA | 10.04 | 10.04 | 10.04 |
SMA (simple moving average) of Blackrock Muniholdings MUE
| SMA period | SMA current | SMA prev | SMA prev2 | | 5 day SMA | 10.01 | 9.99 | 9.98 | | 12 day SMA | 9.97 | 9.97 | 9.96 | | 20 day SMA | 10.01 | 10.01 | 10.01 | | 35 day SMA | 10.05 | 10.05 | 10.05 | | 50 day SMA | 10.04 | 10.04 | 10.04 | | 100 day SMA | 9.81 | 9.8 | 9.8 | | 150 day SMA | 9.74 | 9.73 | 9.73 | | 200 day SMA | 9.79 | 9.79 | 9.8 |
|
|
