BlackrockMuniholdings MUC full analysis,charts,indicators,moving averages,SMA,DMA,EMA,ADX,MACD,RSIBlackrock Muniholdings MUC WideScreen charts, DMA,SMA,EMA technical analysis, forecast prediction, by indicators ADX,MACD,RSI,CCI NYSE stock exchange
operates under N A sector & deals in N A
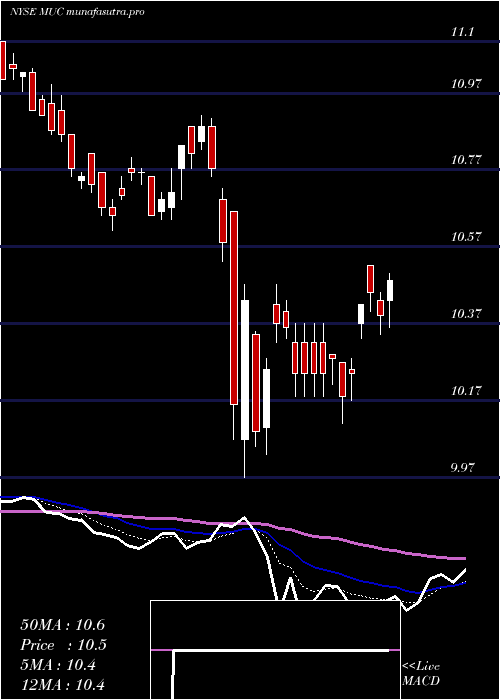
Daily price and charts and targets BlackrockMuniholdings Strong Daily Stock price targets for BlackrockMuniholdings MUC are 10.68 and 10.75 | Daily Target 1 | 10.63 | | Daily Target 2 | 10.66 | | Daily Target 3 | 10.7 | | Daily Target 4 | 10.73 | | Daily Target 5 | 10.77 |
Daily price and volume Blackrock Muniholdings
| Date |
Closing |
Open |
Range |
Volume |
Fri 05 December 2025 |
10.69 (-0.09%) |
10.68 |
10.67 - 10.74 |
1.1735 times |
Thu 04 December 2025 |
10.70 (0.09%) |
10.65 |
10.63 - 10.72 |
1.2255 times |
Wed 03 December 2025 |
10.69 (0.75%) |
10.61 |
10.60 - 10.69 |
1.6106 times |
Tue 02 December 2025 |
10.61 (-0.19%) |
10.62 |
10.58 - 10.65 |
0.9297 times |
Mon 01 December 2025 |
10.63 (-0.75%) |
10.67 |
10.62 - 10.68 |
0.7088 times |
Fri 28 November 2025 |
10.71 (0%) |
10.69 |
10.67 - 10.74 |
0.7828 times |
Wed 26 November 2025 |
10.71 (-0.37%) |
10.70 |
10.70 - 10.75 |
1.1235 times |
Tue 25 November 2025 |
10.75 (0.09%) |
10.75 |
10.72 - 10.78 |
0.8689 times |
Mon 24 November 2025 |
10.74 (0.85%) |
10.69 |
10.66 - 10.74 |
0.9285 times |
Fri 21 November 2025 |
10.65 (0%) |
10.61 |
10.61 - 10.69 |
0.6483 times |
Thu 20 November 2025 |
10.65 (-0.37%) |
10.70 |
10.62 - 10.71 |
0.4626 times |
Weekly price and charts BlackrockMuniholdings Strong weekly Stock price targets for BlackrockMuniholdings MUC are 10.64 and 10.8 | Weekly Target 1 | 10.51 | | Weekly Target 2 | 10.6 | | Weekly Target 3 | 10.67 | | Weekly Target 4 | 10.76 | | Weekly Target 5 | 10.83 |
Weekly price and volumes for Blackrock Muniholdings
| Date |
Closing |
Open |
Range |
Volume |
Fri 05 December 2025 |
10.69 (-0.19%) |
10.67 |
10.58 - 10.74 |
1.6517 times |
Fri 28 November 2025 |
10.71 (0.56%) |
10.69 |
10.66 - 10.78 |
1.0831 times |
Fri 21 November 2025 |
10.65 (-0.75%) |
10.76 |
10.61 - 10.77 |
1.0786 times |
Fri 14 November 2025 |
10.73 (-0.83%) |
10.85 |
10.70 - 10.90 |
1.1445 times |
Fri 07 November 2025 |
10.82 (-0.46%) |
10.84 |
10.76 - 10.87 |
0.7615 times |
Fri 31 October 2025 |
10.87 (0%) |
10.86 |
10.84 - 10.93 |
0.2518 times |
Fri 31 October 2025 |
10.87 (0.09%) |
10.87 |
10.82 - 10.94 |
1.0946 times |
Fri 24 October 2025 |
10.86 (1.69%) |
10.72 |
10.67 - 10.87 |
0.8605 times |
Fri 17 October 2025 |
10.68 (-0.28%) |
10.75 |
10.66 - 10.86 |
1.5418 times |
Tue 07 October 2025 |
10.71 (-1.29%) |
10.85 |
10.68 - 10.86 |
0.5319 times |
Fri 03 October 2025 |
10.85 (1.12%) |
10.78 |
10.74 - 10.88 |
0.8453 times |
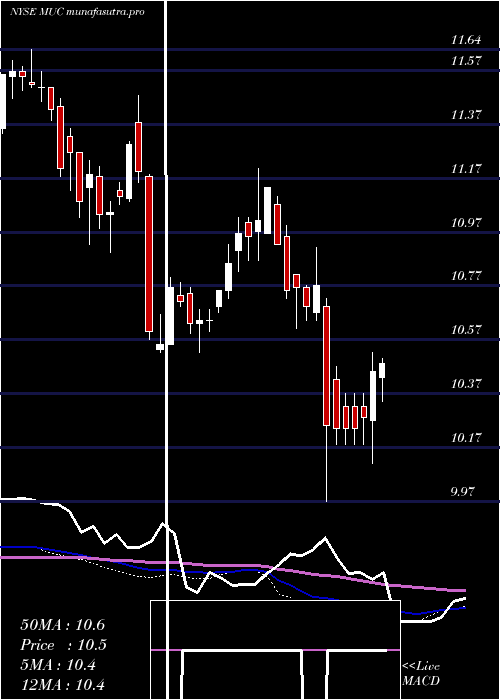
Monthly price and charts BlackrockMuniholdings Strong monthly Stock price targets for BlackrockMuniholdings MUC are 10.64 and 10.8 | Monthly Target 1 | 10.51 | | Monthly Target 2 | 10.6 | | Monthly Target 3 | 10.67 | | Monthly Target 4 | 10.76 | | Monthly Target 5 | 10.83 |
Monthly price and volumes Blackrock Muniholdings
| Date |
Closing |
Open |
Range |
Volume |
Fri 05 December 2025 |
10.69 (-0.19%) |
10.67 |
10.58 - 10.74 |
0.4127 times |
Fri 28 November 2025 |
10.71 (-1.47%) |
10.84 |
10.61 - 10.90 |
1.0164 times |
Fri 31 October 2025 |
10.87 (0.18%) |
10.85 |
10.66 - 10.94 |
1.1898 times |
Tue 30 September 2025 |
10.85 (5.34%) |
10.29 |
10.25 - 10.93 |
1.1647 times |
Fri 29 August 2025 |
10.30 (2.39%) |
10.09 |
10.07 - 10.35 |
1.2342 times |
Thu 31 July 2025 |
10.06 (-2.8%) |
10.37 |
10.00 - 10.42 |
1.1233 times |
Mon 30 June 2025 |
10.35 (0.1%) |
10.34 |
10.19 - 10.41 |
1.0939 times |
Fri 30 May 2025 |
10.34 (-1.99%) |
10.64 |
10.17 - 10.67 |
0.7703 times |
Wed 30 April 2025 |
10.55 (-1.49%) |
10.77 |
9.97 - 10.91 |
1.1122 times |
Mon 31 March 2025 |
10.71 (-3.77%) |
11.07 |
10.61 - 11.10 |
0.8825 times |
Fri 28 February 2025 |
11.13 (2.58%) |
10.90 |
10.82 - 11.20 |
0.8393 times |

DMA SMA EMA moving averages of Blackrock Muniholdings MUC
DMA (daily moving average) of Blackrock Muniholdings MUC
| DMA period | DMA value | | 5 day DMA | 10.66 | | 12 day DMA | 10.69 | | 20 day DMA | 10.72 | | 35 day DMA | 10.77 | | 50 day DMA | 10.77 | | 100 day DMA | 10.55 | | 150 day DMA | 10.5 | | 200 day DMA | 10.54 | EMA (exponential moving average) of Blackrock Muniholdings MUC
| EMA period | EMA current | EMA prev | EMA prev2 | | 5 day EMA | 10.68 | 10.68 | 10.67 | | 12 day EMA | 10.69 | 10.69 | 10.69 | | 20 day EMA | 10.74 | 10.74 | 10.74 | | 35 day EMA | 10.74 | 10.74 | 10.74 | | 50 day EMA | 10.76 | 10.76 | 10.76 |
SMA (simple moving average) of Blackrock Muniholdings MUC
| SMA period | SMA current | SMA prev | SMA prev2 | | 5 day SMA | 10.66 | 10.67 | 10.67 | | 12 day SMA | 10.69 | 10.69 | 10.69 | | 20 day SMA | 10.72 | 10.73 | 10.73 | | 35 day SMA | 10.77 | 10.77 | 10.77 | | 50 day SMA | 10.77 | 10.77 | 10.77 | | 100 day SMA | 10.55 | 10.55 | 10.54 | | 150 day SMA | 10.5 | 10.49 | 10.49 | | 200 day SMA | 10.54 | 10.54 | 10.54 |
|
|
