ManitowocCompany MTW full analysis,charts,indicators,moving averages,SMA,DMA,EMA,ADX,MACD,RSIManitowoc Company MTW WideScreen charts, DMA,SMA,EMA technical analysis, forecast prediction, by indicators ADX,MACD,RSI,CCI NYSE stock exchange
operates under Capital Goods sector & deals in Construction Ag Equipment Trucks
Daily price and charts and targets ManitowocCompany Strong Daily Stock price targets for ManitowocCompany MTW are 12.13 and 12.43 | Daily Target 1 | 11.88 | | Daily Target 2 | 12.08 | | Daily Target 3 | 12.183333333333 | | Daily Target 4 | 12.38 | | Daily Target 5 | 12.48 |
Daily price and volume Manitowoc Company
| Date |
Closing |
Open |
Range |
Volume |
Fri 05 December 2025 |
12.27 (1.15%) |
12.09 |
11.99 - 12.29 |
1.1563 times |
Thu 04 December 2025 |
12.13 (1.85%) |
11.85 |
11.72 - 12.20 |
1.2855 times |
Wed 03 December 2025 |
11.91 (5.31%) |
11.35 |
11.19 - 11.95 |
1.0148 times |
Tue 02 December 2025 |
11.31 (0.62%) |
11.31 |
11.13 - 11.37 |
0.7394 times |
Mon 01 December 2025 |
11.24 (-0.35%) |
11.11 |
11.11 - 11.38 |
1.0392 times |
Fri 28 November 2025 |
11.28 (-0.35%) |
11.31 |
11.19 - 11.39 |
0.4094 times |
Wed 26 November 2025 |
11.32 (-0.26%) |
11.31 |
11.16 - 11.40 |
0.8395 times |
Tue 25 November 2025 |
11.35 (2.07%) |
11.20 |
11.11 - 11.41 |
0.8967 times |
Mon 24 November 2025 |
11.12 (2.96%) |
10.88 |
10.60 - 11.15 |
1.3024 times |
Fri 21 November 2025 |
10.80 (4.25%) |
10.44 |
10.39 - 10.81 |
1.3167 times |
Thu 20 November 2025 |
10.36 (-0.77%) |
10.68 |
10.29 - 10.83 |
1.5567 times |
Weekly price and charts ManitowocCompany Strong weekly Stock price targets for ManitowocCompany MTW are 11.69 and 12.87 | Weekly Target 1 | 10.71 | | Weekly Target 2 | 11.49 | | Weekly Target 3 | 11.89 | | Weekly Target 4 | 12.67 | | Weekly Target 5 | 13.07 |
Weekly price and volumes for Manitowoc Company
| Date |
Closing |
Open |
Range |
Volume |
Fri 05 December 2025 |
12.27 (8.78%) |
11.11 |
11.11 - 12.29 |
1.0229 times |
Fri 28 November 2025 |
11.28 (4.44%) |
10.88 |
10.60 - 11.41 |
0.6737 times |
Fri 21 November 2025 |
10.80 (-2.88%) |
11.04 |
10.29 - 11.12 |
1.1918 times |
Fri 14 November 2025 |
11.12 (1.65%) |
11.03 |
10.84 - 11.56 |
1.3128 times |
Fri 07 November 2025 |
10.94 (7.57%) |
10.00 |
9.94 - 11.68 |
1.4695 times |
Fri 31 October 2025 |
10.17 (0%) |
10.25 |
10.10 - 10.31 |
0.3036 times |
Fri 31 October 2025 |
10.17 (-11.26%) |
11.61 |
10.10 - 11.62 |
1.1453 times |
Fri 24 October 2025 |
11.46 (6.01%) |
10.96 |
10.76 - 11.59 |
1.5551 times |
Fri 17 October 2025 |
10.81 (3.25%) |
10.14 |
10.08 - 11.18 |
0.9804 times |
Tue 07 October 2025 |
10.47 (-0.29%) |
10.65 |
10.39 - 10.79 |
0.3448 times |
Fri 03 October 2025 |
10.50 (5.21%) |
10.04 |
9.78 - 10.65 |
1.0542 times |

Monthly price and charts ManitowocCompany Strong monthly Stock price targets for ManitowocCompany MTW are 11.69 and 12.87 | Monthly Target 1 | 10.71 | | Monthly Target 2 | 11.49 | | Monthly Target 3 | 11.89 | | Monthly Target 4 | 12.67 | | Monthly Target 5 | 13.07 |
Monthly price and volumes Manitowoc Company
| Date |
Closing |
Open |
Range |
Volume |
Fri 05 December 2025 |
12.27 (8.78%) |
11.11 |
11.11 - 12.29 |
0.1951 times |
Fri 28 November 2025 |
11.28 (10.91%) |
10.00 |
9.94 - 11.68 |
0.8867 times |
Fri 31 October 2025 |
10.17 (1.6%) |
9.86 |
9.86 - 11.62 |
0.9369 times |
Tue 30 September 2025 |
10.01 (1.11%) |
9.70 |
9.66 - 10.46 |
1.1999 times |
Fri 29 August 2025 |
9.90 (-22.35%) |
12.36 |
9.09 - 12.65 |
1.597 times |
Thu 31 July 2025 |
12.75 (6.07%) |
11.90 |
11.80 - 13.62 |
1.0371 times |
Mon 30 June 2025 |
12.02 (14.37%) |
10.59 |
10.28 - 12.45 |
0.8745 times |
Fri 30 May 2025 |
10.51 (33.38%) |
7.90 |
7.58 - 11.81 |
1.2942 times |
Wed 30 April 2025 |
7.88 (-8.27%) |
8.50 |
7.06 - 8.95 |
1.1415 times |
Mon 31 March 2025 |
8.59 (-17%) |
10.39 |
8.49 - 10.45 |
0.837 times |
Fri 28 February 2025 |
10.35 (3.6%) |
9.69 |
9.28 - 12.20 |
1.384 times |

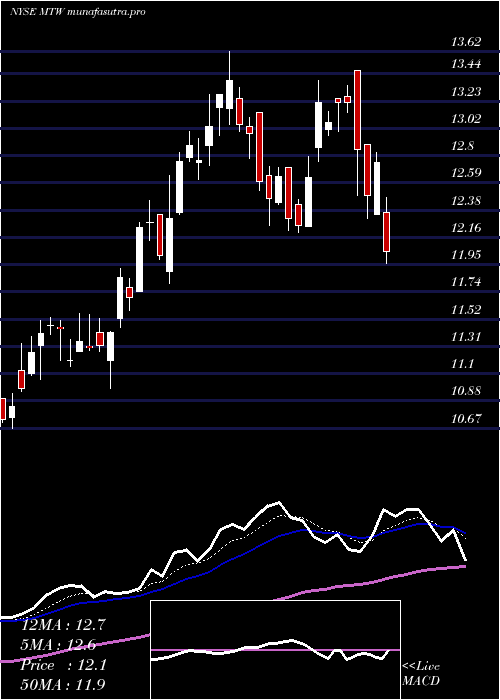
DMA SMA EMA moving averages of Manitowoc Company MTW
DMA (daily moving average) of Manitowoc Company MTW
| DMA period | DMA value | | 5 day DMA | 11.77 | | 12 day DMA | 11.29 | | 20 day DMA | 11.19 | | 35 day DMA | 11.04 | | 50 day DMA | 10.82 | | 100 day DMA | 10.87 | | 150 day DMA | 10.93 | | 200 day DMA | 10.42 | EMA (exponential moving average) of Manitowoc Company MTW
| EMA period | EMA current | EMA prev | EMA prev2 | | 5 day EMA | 11.88 | 11.68 | 11.46 | | 12 day EMA | 11.5 | 11.36 | 11.22 | | 20 day EMA | 11.27 | 11.17 | 11.07 | | 35 day EMA | 11.05 | 10.98 | 10.91 | | 50 day EMA | 10.86 | 10.8 | 10.75 |
SMA (simple moving average) of Manitowoc Company MTW
| SMA period | SMA current | SMA prev | SMA prev2 | | 5 day SMA | 11.77 | 11.57 | 11.41 | | 12 day SMA | 11.29 | 11.15 | 11.01 | | 20 day SMA | 11.19 | 11.14 | 11.05 | | 35 day SMA | 11.04 | 11.01 | 10.97 | | 50 day SMA | 10.82 | 10.78 | 10.73 | | 100 day SMA | 10.87 | 10.88 | 10.89 | | 150 day SMA | 10.93 | 10.9 | 10.87 | | 200 day SMA | 10.42 | 10.42 | 10.42 |
|
|
