MgicInvestment MTG full analysis,charts,indicators,moving averages,SMA,DMA,EMA,ADX,MACD,RSIMgic Investment MTG WideScreen charts, DMA,SMA,EMA technical analysis, forecast prediction, by indicators ADX,MACD,RSI,CCI NYSE stock exchange
operates under Finance sector & deals in Property Casualty Insurers
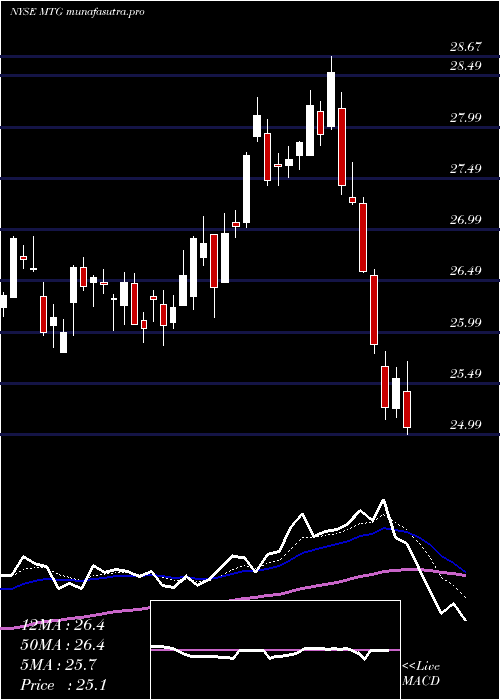
Daily price and charts and targets MgicInvestment Strong Daily Stock price targets for MgicInvestment MTG are 27.21 and 27.64 | Daily Target 1 | 26.87 | | Daily Target 2 | 27.12 | | Daily Target 3 | 27.303333333333 | | Daily Target 4 | 27.55 | | Daily Target 5 | 27.73 |
Daily price and volume Mgic Investment
| Date |
Closing |
Open |
Range |
Volume |
Wed 22 October 2025 |
27.36 (0.7%) |
27.06 |
27.06 - 27.49 |
0.867 times |
Tue 21 October 2025 |
27.17 (0.37%) |
26.97 |
26.89 - 27.41 |
1.0096 times |
Mon 20 October 2025 |
27.07 (0.56%) |
27.00 |
26.72 - 27.19 |
0.8436 times |
Fri 17 October 2025 |
26.92 (1.36%) |
26.71 |
26.58 - 26.97 |
0.8784 times |
Thu 16 October 2025 |
26.56 (-2.96%) |
27.28 |
26.37 - 27.28 |
1.1816 times |
Wed 15 October 2025 |
27.37 (-1.05%) |
27.68 |
27.19 - 27.88 |
1.2087 times |
Tue 14 October 2025 |
27.66 (2.6%) |
26.89 |
26.89 - 27.75 |
1.1867 times |
Mon 13 October 2025 |
26.96 (-0.3%) |
26.71 |
26.65 - 27.09 |
1.0168 times |
Tue 07 October 2025 |
27.04 (-0.7%) |
27.20 |
26.99 - 27.34 |
1.0567 times |
Mon 06 October 2025 |
27.23 (-1.02%) |
27.55 |
27.13 - 27.67 |
0.7509 times |
Fri 03 October 2025 |
27.51 (-0.86%) |
27.74 |
27.33 - 27.92 |
0.9562 times |
Weekly price and charts MgicInvestment Strong weekly Stock price targets for MgicInvestment MTG are 27.04 and 27.81 | Weekly Target 1 | 26.42 | | Weekly Target 2 | 26.89 | | Weekly Target 3 | 27.19 | | Weekly Target 4 | 27.66 | | Weekly Target 5 | 27.96 |
Weekly price and volumes for Mgic Investment
| Date |
Closing |
Open |
Range |
Volume |
Wed 22 October 2025 |
27.36 (1.63%) |
27.00 |
26.72 - 27.49 |
0.5796 times |
Fri 17 October 2025 |
26.92 (-0.44%) |
26.71 |
26.37 - 27.88 |
1.1659 times |
Tue 07 October 2025 |
27.04 (-1.71%) |
27.55 |
26.99 - 27.67 |
0.3851 times |
Fri 03 October 2025 |
27.51 (-4.38%) |
28.80 |
27.33 - 28.80 |
1.0047 times |
Fri 26 September 2025 |
28.77 (1.55%) |
28.22 |
28.06 - 28.77 |
1.4078 times |
Fri 19 September 2025 |
28.33 (-0.35%) |
28.38 |
27.75 - 29.01 |
2.6406 times |
Fri 12 September 2025 |
28.43 (0.11%) |
28.35 |
28.07 - 28.98 |
0.9298 times |
Fri 05 September 2025 |
28.40 (2.05%) |
27.62 |
27.48 - 28.71 |
0.7498 times |
Fri 29 August 2025 |
27.83 (0%) |
27.66 |
27.65 - 27.87 |
0.2037 times |
Fri 29 August 2025 |
27.83 (-1.14%) |
28.07 |
27.47 - 28.18 |
0.9329 times |
Fri 22 August 2025 |
28.15 (2.33%) |
27.36 |
27.16 - 28.20 |
0.9613 times |
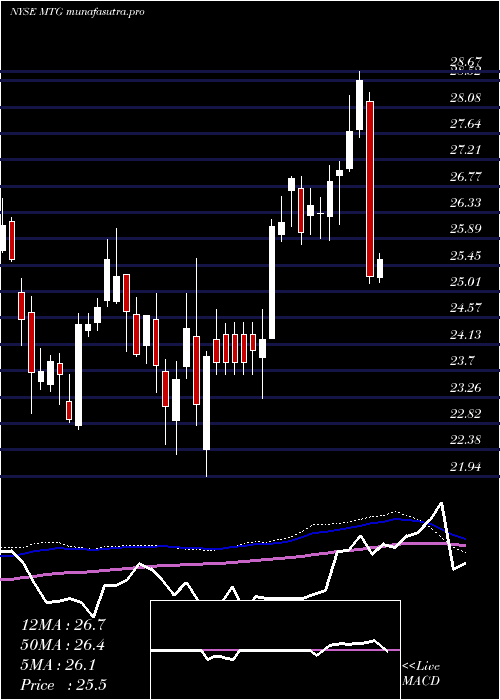
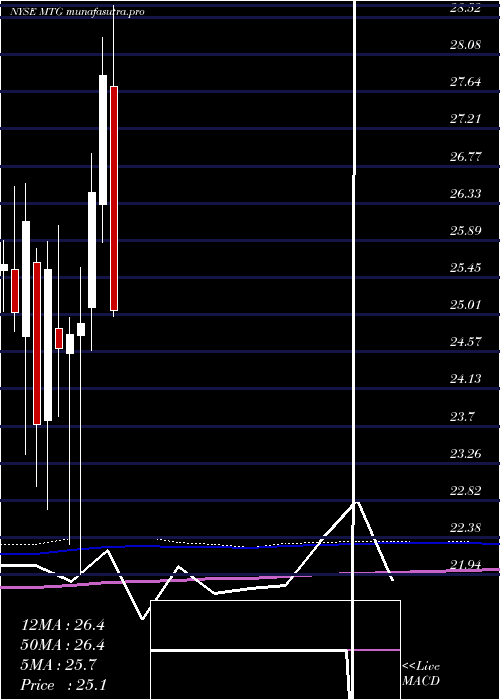
Monthly price and charts MgicInvestment Strong monthly Stock price targets for MgicInvestment MTG are 25.86 and 27.87 | Monthly Target 1 | 25.36 | | Monthly Target 2 | 26.36 | | Monthly Target 3 | 27.37 | | Monthly Target 4 | 28.37 | | Monthly Target 5 | 29.38 |
Monthly price and volumes Mgic Investment
| Date |
Closing |
Open |
Range |
Volume |
Wed 22 October 2025 |
27.36 (-3.56%) |
28.28 |
26.37 - 28.38 |
0.5101 times |
Tue 30 September 2025 |
28.37 (1.94%) |
27.62 |
27.48 - 29.01 |
1.1385 times |
Fri 29 August 2025 |
27.83 (7.45%) |
25.94 |
25.85 - 28.20 |
0.9095 times |
Thu 31 July 2025 |
25.90 (-6.97%) |
27.71 |
24.78 - 28.67 |
1.3427 times |
Mon 30 June 2025 |
27.84 (5.26%) |
26.31 |
25.86 - 28.28 |
0.9801 times |
Fri 30 May 2025 |
26.45 (6.18%) |
25.10 |
24.59 - 26.92 |
0.7903 times |
Wed 30 April 2025 |
24.91 (0.52%) |
24.76 |
21.94 - 25.57 |
1.0201 times |
Mon 31 March 2025 |
24.78 (0.69%) |
24.55 |
22.30 - 24.98 |
1.6062 times |
Fri 28 February 2025 |
24.61 (-3.64%) |
24.85 |
23.81 - 26.07 |
0.8669 times |
Fri 31 January 2025 |
25.54 (7.72%) |
23.76 |
22.71 - 25.88 |
0.8356 times |
Tue 31 December 2024 |
23.71 (-9.19%) |
25.63 |
22.98 - 25.79 |
0.6503 times |
DMA SMA EMA moving averages of Mgic Investment MTG
DMA (daily moving average) of Mgic Investment MTG
| DMA period | DMA value | | 5 day DMA | 27.02 | | 12 day DMA | 27.22 | | 20 day DMA | 27.68 | | 35 day DMA | 27.92 | | 50 day DMA | 27.85 | | 100 day DMA | 27.17 | | 150 day DMA | 26.36 | | 200 day DMA | 25.84 | EMA (exponential moving average) of Mgic Investment MTG
| EMA period | EMA current | EMA prev | EMA prev2 | | 5 day EMA | 27.19 | 27.1 | 27.06 | | 12 day EMA | 27.32 | 27.31 | 27.34 | | 20 day EMA | 27.5 | 27.51 | 27.55 | | 35 day EMA | 27.61 | 27.62 | 27.65 | | 50 day EMA | 27.68 | 27.69 | 27.71 |
SMA (simple moving average) of Mgic Investment MTG
| SMA period | SMA current | SMA prev | SMA prev2 | | 5 day SMA | 27.02 | 27.02 | 27.12 | | 12 day SMA | 27.22 | 27.28 | 27.38 | | 20 day SMA | 27.68 | 27.73 | 27.79 | | 35 day SMA | 27.92 | 27.93 | 27.95 | | 50 day SMA | 27.85 | 27.84 | 27.83 | | 100 day SMA | 27.17 | 27.15 | 27.14 | | 150 day SMA | 26.36 | 26.33 | 26.3 | | 200 day SMA | 25.84 | 25.82 | 25.8 |
|
|
