MatadorResources MTDR full analysis,charts,indicators,moving averages,SMA,DMA,EMA,ADX,MACD,RSIMatador Resources MTDR WideScreen charts, DMA,SMA,EMA technical analysis, forecast prediction, by indicators ADX,MACD,RSI,CCI NYSE stock exchange
operates under Energy sector & deals in Oil Gas Production
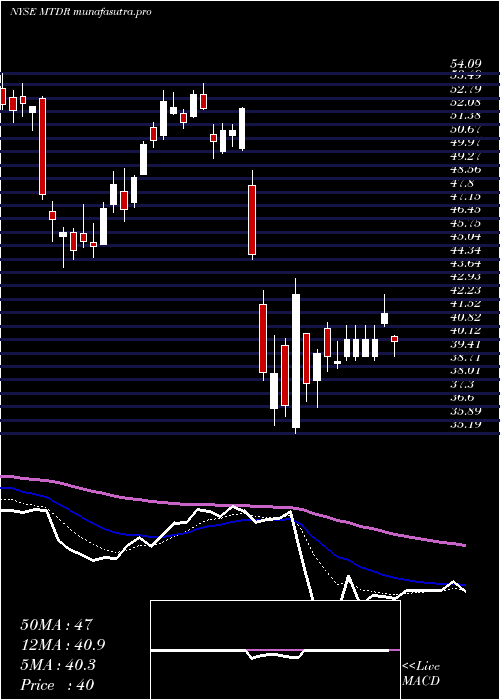
Daily price and charts and targets MatadorResources Strong Daily Stock price targets for MatadorResources MTDR are 44.45 and 44.92 | Daily Target 1 | 44.07 | | Daily Target 2 | 44.35 | | Daily Target 3 | 44.54 | | Daily Target 4 | 44.82 | | Daily Target 5 | 45.01 |
Daily price and volume Matador Resources
| Date |
Closing |
Open |
Range |
Volume |
Thu 04 December 2025 |
44.63 (0.79%) |
44.28 |
44.26 - 44.73 |
0.8119 times |
Wed 03 December 2025 |
44.28 (3.1%) |
43.32 |
43.16 - 44.63 |
0.9041 times |
Tue 02 December 2025 |
42.95 (-1.29%) |
43.19 |
42.55 - 43.47 |
0.863 times |
Mon 01 December 2025 |
43.51 (2.62%) |
42.44 |
42.25 - 43.83 |
1.0645 times |
Fri 28 November 2025 |
42.40 (1.75%) |
41.58 |
41.47 - 42.67 |
0.3809 times |
Wed 26 November 2025 |
41.67 (1.07%) |
41.30 |
41.23 - 42.20 |
0.945 times |
Tue 25 November 2025 |
41.23 (-0.22%) |
40.92 |
40.30 - 41.30 |
0.9938 times |
Mon 24 November 2025 |
41.32 (0.61%) |
40.70 |
40.05 - 41.46 |
1.58 times |
Fri 21 November 2025 |
41.07 (1.51%) |
40.15 |
39.93 - 41.53 |
1.0806 times |
Thu 20 November 2025 |
40.46 (-1.39%) |
41.19 |
40.36 - 42.31 |
1.3761 times |
Wed 19 November 2025 |
41.03 (-0.29%) |
40.20 |
39.70 - 41.11 |
1.2798 times |
Weekly price and charts MatadorResources Strong weekly Stock price targets for MatadorResources MTDR are 43.44 and 45.92 | Weekly Target 1 | 41.39 | | Weekly Target 2 | 43.01 | | Weekly Target 3 | 43.87 | | Weekly Target 4 | 45.49 | | Weekly Target 5 | 46.35 |
Weekly price and volumes for Matador Resources
| Date |
Closing |
Open |
Range |
Volume |
Thu 04 December 2025 |
44.63 (5.26%) |
42.44 |
42.25 - 44.73 |
0.6219 times |
Fri 28 November 2025 |
42.40 (3.24%) |
40.70 |
40.05 - 42.67 |
0.6656 times |
Fri 21 November 2025 |
41.07 (-0.87%) |
41.27 |
39.55 - 42.31 |
0.9308 times |
Fri 14 November 2025 |
41.43 (5.29%) |
39.51 |
38.80 - 41.49 |
1.3038 times |
Fri 07 November 2025 |
39.35 (-0.28%) |
38.92 |
37.14 - 39.45 |
1.2271 times |
Fri 31 October 2025 |
39.46 (0%) |
39.49 |
39.22 - 39.92 |
0.1714 times |
Fri 31 October 2025 |
39.46 (0.38%) |
39.90 |
38.56 - 40.54 |
1.4304 times |
Fri 24 October 2025 |
39.31 (-8.6%) |
42.98 |
38.90 - 44.12 |
2.2008 times |
Fri 17 October 2025 |
43.01 (-2.85%) |
42.81 |
42.07 - 43.88 |
1.0685 times |
Tue 07 October 2025 |
44.27 (-1.67%) |
45.50 |
43.37 - 45.70 |
0.3797 times |
Fri 03 October 2025 |
45.02 (-8.14%) |
48.48 |
43.31 - 48.55 |
1.2421 times |
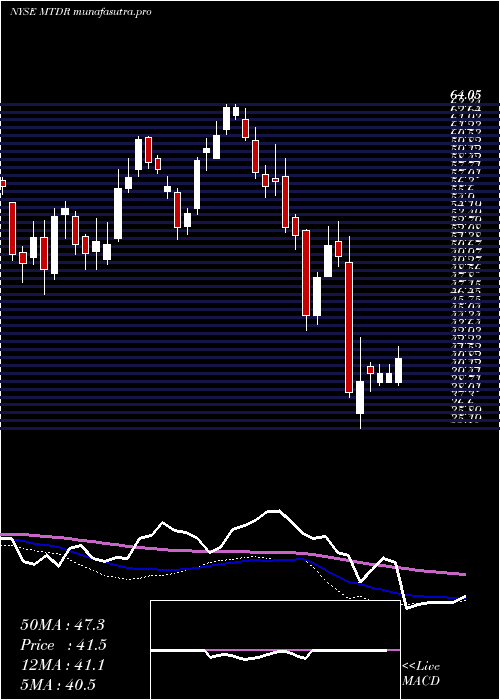
Monthly price and charts MatadorResources Strong monthly Stock price targets for MatadorResources MTDR are 43.44 and 45.92 | Monthly Target 1 | 41.39 | | Monthly Target 2 | 43.01 | | Monthly Target 3 | 43.87 | | Monthly Target 4 | 45.49 | | Monthly Target 5 | 46.35 |
Monthly price and volumes Matador Resources
| Date |
Closing |
Open |
Range |
Volume |
Thu 04 December 2025 |
44.63 (5.26%) |
42.44 |
42.25 - 44.73 |
0.1377 times |
Fri 28 November 2025 |
42.40 (7.45%) |
38.92 |
37.14 - 42.67 |
0.914 times |
Fri 31 October 2025 |
39.46 (-12.17%) |
44.31 |
38.56 - 45.70 |
1.2935 times |
Tue 30 September 2025 |
44.93 (-10.78%) |
50.16 |
44.15 - 51.22 |
1.0251 times |
Fri 29 August 2025 |
50.36 (0.96%) |
49.30 |
45.37 - 50.71 |
0.9043 times |
Thu 31 July 2025 |
49.88 (4.53%) |
47.70 |
47.35 - 53.04 |
1.2042 times |
Mon 30 June 2025 |
47.72 (10.95%) |
44.48 |
42.79 - 52.49 |
0.8947 times |
Fri 30 May 2025 |
43.01 (8.78%) |
39.49 |
39.26 - 46.77 |
1.0203 times |
Wed 30 April 2025 |
39.54 (-22.61%) |
50.84 |
35.19 - 52.31 |
1.5362 times |
Mon 31 March 2025 |
51.09 (-2.39%) |
52.78 |
43.89 - 53.57 |
1.07 times |
Fri 28 February 2025 |
52.34 (-9.76%) |
57.80 |
51.08 - 60.43 |
0.6779 times |

DMA SMA EMA moving averages of Matador Resources MTDR
DMA (daily moving average) of Matador Resources MTDR
| DMA period | DMA value | | 5 day DMA | 43.55 | | 12 day DMA | 42.14 | | 20 day DMA | 41.26 | | 35 day DMA | 40.87 | | 50 day DMA | 42.21 | | 100 day DMA | 45.54 | | 150 day DMA | 45.68 | | 200 day DMA | 46.04 | EMA (exponential moving average) of Matador Resources MTDR
| EMA period | EMA current | EMA prev | EMA prev2 | | 5 day EMA | 43.6 | 43.09 | 42.49 | | 12 day EMA | 42.49 | 42.1 | 41.7 | | 20 day EMA | 41.95 | 41.67 | 41.39 | | 35 day EMA | 42.29 | 42.15 | 42.02 | | 50 day EMA | 42.74 | 42.66 | 42.59 |
SMA (simple moving average) of Matador Resources MTDR
| SMA period | SMA current | SMA prev | SMA prev2 | | 5 day SMA | 43.55 | 42.96 | 42.35 | | 12 day SMA | 42.14 | 41.76 | 41.53 | | 20 day SMA | 41.26 | 40.89 | 40.62 | | 35 day SMA | 40.87 | 40.83 | 40.79 | | 50 day SMA | 42.21 | 42.22 | 42.28 | | 100 day SMA | 45.54 | 45.62 | 45.69 | | 150 day SMA | 45.68 | 45.66 | 45.64 | | 200 day SMA | 46.04 | 46.1 | 46.17 |
|
|
