MotorolaSolutions MSI full analysis,charts,indicators,moving averages,SMA,DMA,EMA,ADX,MACD,RSIMotorola Solutions MSI WideScreen charts, DMA,SMA,EMA technical analysis, forecast prediction, by indicators ADX,MACD,RSI,CCI NYSE stock exchange
operates under Technology sector & deals in Radio And Television Broadcasting And Communications Equipment
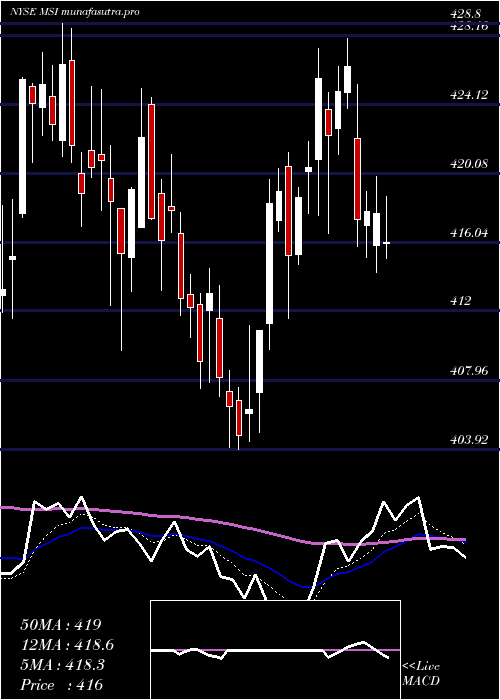
Daily price and charts and targets MotorolaSolutions Strong Daily Stock price targets for MotorolaSolutions MSI are 446.57 and 450.71 | Daily Target 1 | 443.19 | | Daily Target 2 | 445.81 | | Daily Target 3 | 447.32666666667 | | Daily Target 4 | 449.95 | | Daily Target 5 | 451.47 |
Daily price and volume Motorola Solutions
| Date |
Closing |
Open |
Range |
Volume |
Mon 20 October 2025 |
448.44 (0.77%) |
445.00 |
444.70 - 448.84 |
0.6623 times |
Fri 17 October 2025 |
445.00 (1.78%) |
437.41 |
437.27 - 445.74 |
0.8711 times |
Thu 16 October 2025 |
437.21 (-0.39%) |
439.86 |
434.47 - 441.16 |
1.3374 times |
Wed 15 October 2025 |
438.94 (-4.71%) |
461.24 |
437.70 - 462.09 |
2.0676 times |
Tue 14 October 2025 |
460.62 (0.96%) |
458.93 |
457.07 - 464.35 |
0.9641 times |
Mon 13 October 2025 |
456.25 (-0.49%) |
457.32 |
454.77 - 459.69 |
0.7862 times |
Tue 07 October 2025 |
458.50 (0.3%) |
457.65 |
453.96 - 459.01 |
1.0646 times |
Mon 06 October 2025 |
457.13 (0.93%) |
453.01 |
450.00 - 458.42 |
0.6324 times |
Fri 03 October 2025 |
452.90 (1.09%) |
448.25 |
447.98 - 458.91 |
0.9417 times |
Thu 02 October 2025 |
448.03 (-1.95%) |
456.08 |
447.66 - 457.38 |
0.6726 times |
Wed 01 October 2025 |
456.93 (-0.08%) |
454.82 |
453.16 - 458.31 |
1.1801 times |
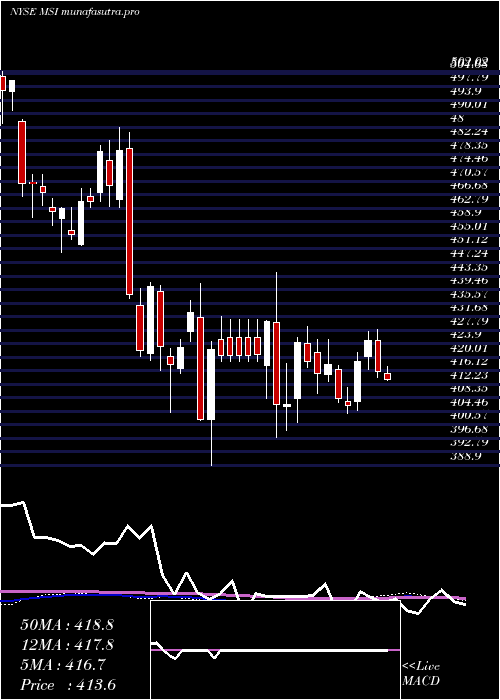
Weekly price and charts MotorolaSolutions Strong weekly Stock price targets for MotorolaSolutions MSI are 446.57 and 450.71 | Weekly Target 1 | 443.19 | | Weekly Target 2 | 445.81 | | Weekly Target 3 | 447.32666666667 | | Weekly Target 4 | 449.95 | | Weekly Target 5 | 451.47 |
Weekly price and volumes for Motorola Solutions
| Date |
Closing |
Open |
Range |
Volume |
Mon 20 October 2025 |
448.44 (0.77%) |
445.00 |
444.70 - 448.84 |
0.1298 times |
Fri 17 October 2025 |
445.00 (-2.94%) |
457.32 |
434.47 - 464.35 |
1.1811 times |
Tue 07 October 2025 |
458.50 (1.24%) |
453.01 |
450.00 - 459.01 |
0.3326 times |
Fri 03 October 2025 |
452.90 (-0.79%) |
458.75 |
447.66 - 459.66 |
1.0119 times |
Fri 26 September 2025 |
456.52 (-4.13%) |
476.67 |
454.32 - 477.52 |
1.3097 times |
Fri 19 September 2025 |
476.21 (-1.14%) |
479.75 |
471.44 - 485.56 |
1.611 times |
Fri 12 September 2025 |
481.71 (0.57%) |
477.75 |
473.03 - 492.22 |
1.2879 times |
Fri 05 September 2025 |
478.98 (1.38%) |
469.96 |
466.70 - 480.19 |
1.1542 times |
Fri 29 August 2025 |
472.46 (0%) |
470.14 |
469.08 - 474.20 |
0.3038 times |
Fri 29 August 2025 |
472.46 (2.28%) |
462.80 |
451.63 - 474.20 |
1.678 times |
Fri 22 August 2025 |
461.91 (0.35%) |
460.24 |
457.99 - 467.86 |
1.299 times |
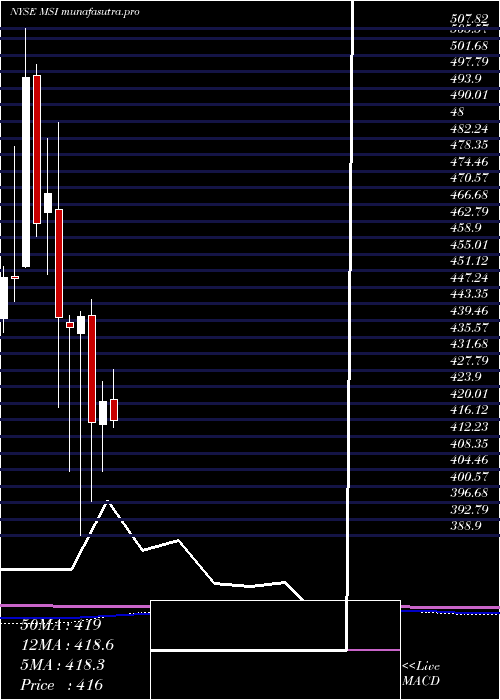
Monthly price and charts MotorolaSolutions Strong monthly Stock price targets for MotorolaSolutions MSI are 426.52 and 456.4 | Monthly Target 1 | 419.21 | | Monthly Target 2 | 433.82 | | Monthly Target 3 | 449.08666666667 | | Monthly Target 4 | 463.7 | | Monthly Target 5 | 478.97 |
Monthly price and volumes Motorola Solutions
| Date |
Closing |
Open |
Range |
Volume |
Mon 20 October 2025 |
448.44 (-1.94%) |
454.82 |
434.47 - 464.35 |
0.3988 times |
Tue 30 September 2025 |
457.29 (-3.21%) |
469.96 |
452.92 - 492.22 |
1.0605 times |
Fri 29 August 2025 |
472.46 (7.63%) |
438.53 |
429.71 - 474.20 |
1.2963 times |
Thu 31 July 2025 |
438.98 (4.4%) |
420.87 |
408.60 - 441.72 |
1.0049 times |
Mon 30 June 2025 |
420.46 (1.22%) |
415.13 |
403.92 - 425.08 |
0.9916 times |
Fri 30 May 2025 |
415.38 (-5.68%) |
440.50 |
397.00 - 444.37 |
1.3501 times |
Wed 30 April 2025 |
440.39 (0.59%) |
436.38 |
388.90 - 441.55 |
1.0415 times |
Mon 31 March 2025 |
437.81 (-0.55%) |
438.97 |
404.14 - 440.68 |
0.9095 times |
Fri 28 February 2025 |
440.22 (-6.19%) |
465.47 |
418.99 - 485.97 |
1.0088 times |
Fri 31 January 2025 |
469.25 (1.52%) |
464.86 |
450.18 - 482.15 |
0.938 times |
Tue 31 December 2024 |
462.23 (-6.92%) |
497.04 |
459.26 - 499.52 |
0.859 times |
DMA SMA EMA moving averages of Motorola Solutions MSI
DMA (daily moving average) of Motorola Solutions MSI
| DMA period | DMA value | | 5 day DMA | 446.04 | | 12 day DMA | 451.44 | | 20 day DMA | 456.59 | | 35 day DMA | 465.85 | | 50 day DMA | 464.32 | | 100 day DMA | 442.17 | | 150 day DMA | 435.31 | | 200 day DMA | 439.59 | EMA (exponential moving average) of Motorola Solutions MSI
| EMA period | EMA current | EMA prev | EMA prev2 | | 5 day EMA | 446.9 | 446.13 | 446.7 | | 12 day EMA | 451.27 | 451.79 | 453.03 | | 20 day EMA | 455.26 | 455.98 | 457.14 | | 35 day EMA | 457.5 | 458.03 | 458.8 | | 50 day EMA | 460.3 | 460.78 | 461.42 |
SMA (simple moving average) of Motorola Solutions MSI
| SMA period | SMA current | SMA prev | SMA prev2 | | 5 day SMA | 446.04 | 447.6 | 450.3 | | 12 day SMA | 451.44 | 451.92 | 452.88 | | 20 day SMA | 456.59 | 458.06 | 459.65 | | 35 day SMA | 465.85 | 466.3 | 466.61 | | 50 day SMA | 464.32 | 464.2 | 463.98 | | 100 day SMA | 442.17 | 441.95 | 441.73 | | 150 day SMA | 435.31 | 435.07 | 434.85 | | 200 day SMA | 439.59 | 439.67 | 439.78 |
|
|
