MadisonSquare MSGS full analysis,charts,indicators,moving averages,SMA,DMA,EMA,ADX,MACD,RSIMadison Square MSGS WideScreen charts, DMA,SMA,EMA technical analysis, forecast prediction, by indicators ADX,MACD,RSI,CCI NYSE stock exchange
Daily price and charts and targets MadisonSquare Strong Daily Stock price targets for MadisonSquare MSGS are 224.91 and 227.85 | Daily Target 1 | 222.68 | | Daily Target 2 | 224.19 | | Daily Target 3 | 225.61666666667 | | Daily Target 4 | 227.13 | | Daily Target 5 | 228.56 |
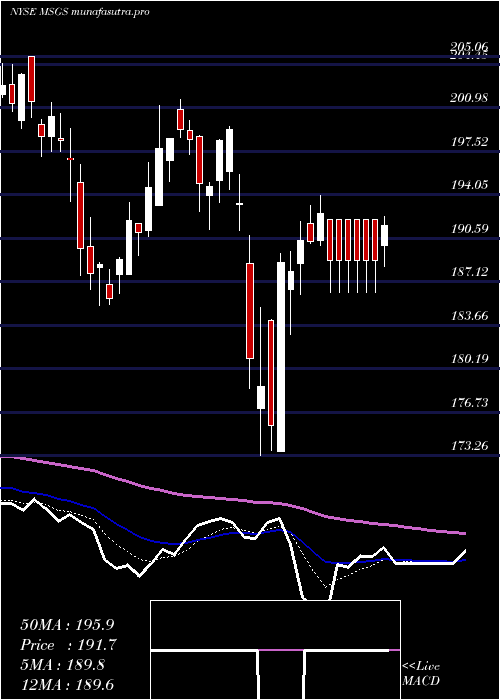
Daily price and volume Madison Square
| Date |
Closing |
Open |
Range |
Volume |
Fri 05 December 2025 |
225.71 (0.72%) |
224.66 |
224.10 - 227.04 |
0.9343 times |
Thu 04 December 2025 |
224.10 (0.25%) |
224.66 |
221.12 - 225.45 |
1.205 times |
Wed 03 December 2025 |
223.54 (0.77%) |
221.78 |
219.00 - 226.55 |
1.128 times |
Tue 02 December 2025 |
221.84 (-1.91%) |
224.13 |
221.02 - 226.50 |
0.9463 times |
Mon 01 December 2025 |
226.17 (-0.82%) |
226.02 |
225.24 - 227.20 |
0.6498 times |
Fri 28 November 2025 |
228.03 (0.98%) |
225.47 |
225.35 - 228.19 |
0.5337 times |
Wed 26 November 2025 |
225.82 (0.47%) |
224.76 |
224.76 - 228.88 |
1.2756 times |
Tue 25 November 2025 |
224.76 (3.41%) |
218.47 |
218.47 - 225.21 |
1.0599 times |
Mon 24 November 2025 |
217.35 (0.5%) |
214.99 |
213.26 - 219.57 |
1.2214 times |
Fri 21 November 2025 |
216.27 (1.19%) |
215.55 |
214.00 - 217.78 |
1.046 times |
Thu 20 November 2025 |
213.72 (-0.67%) |
216.69 |
213.24 - 218.85 |
0.9217 times |
Weekly price and charts MadisonSquare Strong weekly Stock price targets for MadisonSquare MSGS are 218.26 and 226.46 | Weekly Target 1 | 215.77 | | Weekly Target 2 | 220.74 | | Weekly Target 3 | 223.97 | | Weekly Target 4 | 228.94 | | Weekly Target 5 | 232.17 |
Weekly price and volumes for Madison Square
| Date |
Closing |
Open |
Range |
Volume |
Fri 05 December 2025 |
225.71 (-1.02%) |
226.02 |
219.00 - 227.20 |
1.0628 times |
Fri 28 November 2025 |
228.03 (5.44%) |
214.99 |
213.26 - 228.88 |
0.8939 times |
Fri 21 November 2025 |
216.27 (0.15%) |
215.48 |
210.90 - 220.15 |
1.0814 times |
Fri 14 November 2025 |
215.95 (-1.91%) |
220.60 |
214.40 - 224.84 |
0.95 times |
Fri 07 November 2025 |
220.15 (2.69%) |
216.04 |
212.73 - 221.52 |
0.9123 times |
Fri 31 October 2025 |
214.39 (0%) |
213.00 |
207.90 - 218.69 |
0.6984 times |
Fri 31 October 2025 |
214.39 (-5.99%) |
230.23 |
207.90 - 231.52 |
1.7971 times |
Fri 24 October 2025 |
228.05 (4.18%) |
220.00 |
219.00 - 228.58 |
0.9174 times |
Fri 17 October 2025 |
218.91 (-0.27%) |
216.00 |
215.51 - 225.70 |
1.1739 times |
Tue 07 October 2025 |
219.50 (-5.21%) |
232.49 |
217.67 - 233.56 |
0.5126 times |
Fri 03 October 2025 |
231.57 (3.59%) |
224.25 |
223.74 - 235.92 |
1.5122 times |

Monthly price and charts MadisonSquare Strong monthly Stock price targets for MadisonSquare MSGS are 218.26 and 226.46 | Monthly Target 1 | 215.77 | | Monthly Target 2 | 220.74 | | Monthly Target 3 | 223.97 | | Monthly Target 4 | 228.94 | | Monthly Target 5 | 232.17 |
Monthly price and volumes Madison Square
| Date |
Closing |
Open |
Range |
Volume |
Fri 05 December 2025 |
225.71 (-1.02%) |
226.02 |
219.00 - 227.20 |
0.2263 times |
Fri 28 November 2025 |
228.03 (6.36%) |
216.04 |
210.90 - 228.88 |
0.8173 times |
Fri 31 October 2025 |
214.39 (-5.56%) |
225.58 |
207.90 - 235.92 |
1.2421 times |
Tue 30 September 2025 |
227.00 (14.74%) |
196.51 |
193.87 - 231.73 |
1.5203 times |
Fri 29 August 2025 |
197.84 (-2.11%) |
201.99 |
188.60 - 204.56 |
1.3066 times |
Thu 31 July 2025 |
202.10 (-3.28%) |
207.72 |
200.04 - 211.88 |
1.0596 times |
Mon 30 June 2025 |
208.95 (10.04%) |
189.18 |
186.00 - 210.33 |
1.2146 times |
Fri 30 May 2025 |
189.89 (-1.39%) |
193.15 |
184.63 - 199.00 |
0.7988 times |
Wed 30 April 2025 |
192.57 (-1.1%) |
195.17 |
173.26 - 199.48 |
0.8902 times |
Mon 31 March 2025 |
194.72 (-4.4%) |
205.06 |
185.24 - 205.06 |
0.9243 times |
Fri 28 February 2025 |
203.69 (-7.36%) |
219.00 |
199.25 - 222.45 |
0.7053 times |

DMA SMA EMA moving averages of Madison Square MSGS
DMA (daily moving average) of Madison Square MSGS
| DMA period | DMA value | | 5 day DMA | 224.27 | | 12 day DMA | 221.87 | | 20 day DMA | 220.26 | | 35 day DMA | 220.96 | | 50 day DMA | 221.9 | | 100 day DMA | 212.34 | | 150 day DMA | 206.84 | | 200 day DMA | 203.53 | EMA (exponential moving average) of Madison Square MSGS
| EMA period | EMA current | EMA prev | EMA prev2 | | 5 day EMA | 224.39 | 223.73 | 223.54 | | 12 day EMA | 222.7 | 222.15 | 221.8 | | 20 day EMA | 221.72 | 221.3 | 221.01 | | 35 day EMA | 221.4 | 221.15 | 220.98 | | 50 day EMA | 221.63 | 221.46 | 221.35 |
SMA (simple moving average) of Madison Square MSGS
| SMA period | SMA current | SMA prev | SMA prev2 | | 5 day SMA | 224.27 | 224.74 | 225.08 | | 12 day SMA | 221.87 | 220.95 | 220.02 | | 20 day SMA | 220.26 | 219.75 | 219.3 | | 35 day SMA | 220.96 | 220.75 | 220.72 | | 50 day SMA | 221.9 | 221.69 | 221.49 | | 100 day SMA | 212.34 | 212.14 | 211.94 | | 150 day SMA | 206.84 | 206.64 | 206.43 | | 200 day SMA | 203.53 | 203.44 | 203.38 |
|
|
