MadisonSquare MSGE full analysis,charts,indicators,moving averages,SMA,DMA,EMA,ADX,MACD,RSIMadison Square MSGE WideScreen charts, DMA,SMA,EMA technical analysis, forecast prediction, by indicators ADX,MACD,RSI,CCI NYSE stock exchange
Daily price and charts and targets MadisonSquare Strong Daily Stock price targets for MadisonSquare MSGE are 44.96 and 46.6 | Daily Target 1 | 43.65 | | Daily Target 2 | 44.62 | | Daily Target 3 | 45.286666666667 | | Daily Target 4 | 46.26 | | Daily Target 5 | 46.93 |
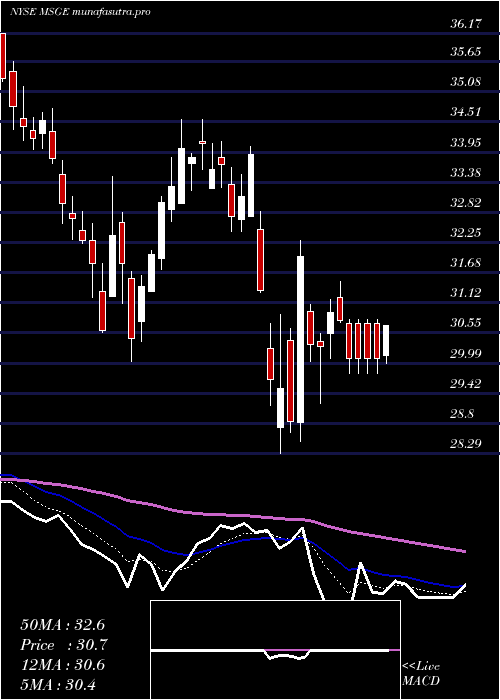
Daily price and volume Madison Square
| Date |
Closing |
Open |
Range |
Volume |
Tue 21 October 2025 |
45.60 (2.47%) |
44.43 |
44.31 - 45.95 |
0.6243 times |
Mon 20 October 2025 |
44.50 (1.37%) |
44.45 |
44.07 - 45.01 |
0.9098 times |
Fri 17 October 2025 |
43.90 (0.57%) |
43.51 |
43.51 - 44.32 |
0.7455 times |
Thu 16 October 2025 |
43.65 (-2.98%) |
44.67 |
43.35 - 44.91 |
0.9608 times |
Wed 15 October 2025 |
44.99 (2.02%) |
44.24 |
44.11 - 45.90 |
1.0498 times |
Tue 14 October 2025 |
44.10 (1.64%) |
43.10 |
42.60 - 44.40 |
1.3125 times |
Mon 13 October 2025 |
43.39 (-0.28%) |
42.50 |
42.19 - 43.43 |
1.8061 times |
Tue 07 October 2025 |
43.51 (-4.65%) |
45.70 |
43.37 - 45.71 |
1.3932 times |
Mon 06 October 2025 |
45.63 (0.11%) |
45.76 |
44.75 - 45.88 |
0.3794 times |
Fri 03 October 2025 |
45.58 (-2.29%) |
46.77 |
45.31 - 47.20 |
0.8186 times |
Thu 02 October 2025 |
46.65 (-2.02%) |
46.96 |
45.63 - 47.80 |
0.7774 times |
Weekly price and charts MadisonSquare Strong weekly Stock price targets for MadisonSquare MSGE are 44.84 and 46.72 | Weekly Target 1 | 43.33 | | Weekly Target 2 | 44.46 | | Weekly Target 3 | 45.206666666667 | | Weekly Target 4 | 46.34 | | Weekly Target 5 | 47.09 |
Weekly price and volumes for Madison Square
| Date |
Closing |
Open |
Range |
Volume |
Tue 21 October 2025 |
45.60 (3.87%) |
44.45 |
44.07 - 45.95 |
0.373 times |
Fri 17 October 2025 |
43.90 (0.9%) |
42.50 |
42.19 - 45.90 |
1.4283 times |
Tue 07 October 2025 |
43.51 (-4.54%) |
45.76 |
43.37 - 45.88 |
0.431 times |
Fri 03 October 2025 |
45.58 (0.64%) |
45.46 |
44.48 - 48.09 |
1.2291 times |
Fri 26 September 2025 |
45.29 (0.31%) |
45.06 |
44.54 - 46.74 |
1.1183 times |
Fri 19 September 2025 |
45.15 (1.99%) |
44.28 |
43.06 - 46.18 |
1.3913 times |
Fri 12 September 2025 |
44.27 (8.35%) |
40.94 |
40.85 - 44.39 |
1.4989 times |
Fri 05 September 2025 |
40.86 (0.37%) |
40.19 |
39.85 - 41.23 |
0.9642 times |
Fri 29 August 2025 |
40.71 (0%) |
40.83 |
40.20 - 40.83 |
0.2513 times |
Fri 29 August 2025 |
40.71 (3.51%) |
39.42 |
38.79 - 40.92 |
1.3146 times |
Fri 22 August 2025 |
39.33 (6.79%) |
36.92 |
36.37 - 39.36 |
1.001 times |

Monthly price and charts MadisonSquare Strong monthly Stock price targets for MadisonSquare MSGE are 40.95 and 46.85 | Monthly Target 1 | 39.39 | | Monthly Target 2 | 42.5 | | Monthly Target 3 | 45.293333333333 | | Monthly Target 4 | 48.4 | | Monthly Target 5 | 51.19 |
Monthly price and volumes Madison Square
| Date |
Closing |
Open |
Range |
Volume |
Tue 21 October 2025 |
45.60 (0.8%) |
45.92 |
42.19 - 48.09 |
0.6876 times |
Tue 30 September 2025 |
45.24 (11.13%) |
40.19 |
39.85 - 46.74 |
1.1677 times |
Fri 29 August 2025 |
40.71 (7.73%) |
37.16 |
35.31 - 40.92 |
1.1054 times |
Thu 31 July 2025 |
37.79 (-5.45%) |
39.63 |
37.44 - 41.02 |
0.8968 times |
Mon 30 June 2025 |
39.97 (7.71%) |
37.00 |
36.11 - 41.24 |
1.1274 times |
Fri 30 May 2025 |
37.11 (14.4%) |
32.54 |
32.31 - 38.81 |
0.789 times |
Wed 30 April 2025 |
32.44 (-0.92%) |
32.68 |
28.29 - 34.06 |
0.8438 times |
Mon 31 March 2025 |
32.74 (-5.18%) |
34.34 |
30.01 - 34.76 |
1.0744 times |
Fri 28 February 2025 |
34.53 (-4.98%) |
35.90 |
33.99 - 38.56 |
1.0765 times |
Fri 31 January 2025 |
36.34 (2.08%) |
35.80 |
33.52 - 37.09 |
1.2316 times |
Tue 31 December 2024 |
35.60 (-3.21%) |
38.71 |
32.39 - 38.80 |
0.9508 times |

DMA SMA EMA moving averages of Madison Square MSGE
DMA (daily moving average) of Madison Square MSGE
| DMA period | DMA value | | 5 day DMA | 44.53 | | 12 day DMA | 44.93 | | 20 day DMA | 45.09 | | 35 day DMA | 43.96 | | 50 day DMA | 42.28 | | 100 day DMA | 40.48 | | 150 day DMA | 38.06 | | 200 day DMA | 37.38 | EMA (exponential moving average) of Madison Square MSGE
| EMA period | EMA current | EMA prev | EMA prev2 | | 5 day EMA | 44.71 | 44.27 | 44.15 | | 12 day EMA | 44.69 | 44.52 | 44.52 | | 20 day EMA | 44.48 | 44.36 | 44.34 | | 35 day EMA | 43.36 | 43.23 | 43.16 | | 50 day EMA | 42.13 | 41.99 | 41.89 |
SMA (simple moving average) of Madison Square MSGE
| SMA period | SMA current | SMA prev | SMA prev2 | | 5 day SMA | 44.53 | 44.23 | 44.01 | | 12 day SMA | 44.93 | 44.9 | 44.95 | | 20 day SMA | 45.09 | 45.1 | 45.12 | | 35 day SMA | 43.96 | 43.82 | 43.68 | | 50 day SMA | 42.28 | 42.13 | 42 | | 100 day SMA | 40.48 | 40.39 | 40.31 | | 150 day SMA | 38.06 | 37.97 | 37.89 | | 200 day SMA | 37.38 | 37.34 | 37.28 |
|
|
