MorganStanley MSD full analysis,charts,indicators,moving averages,SMA,DMA,EMA,ADX,MACD,RSIMorgan Stanley MSD WideScreen charts, DMA,SMA,EMA technical analysis, forecast prediction, by indicators ADX,MACD,RSI,CCI NYSE stock exchange
operates under N A sector & deals in N A
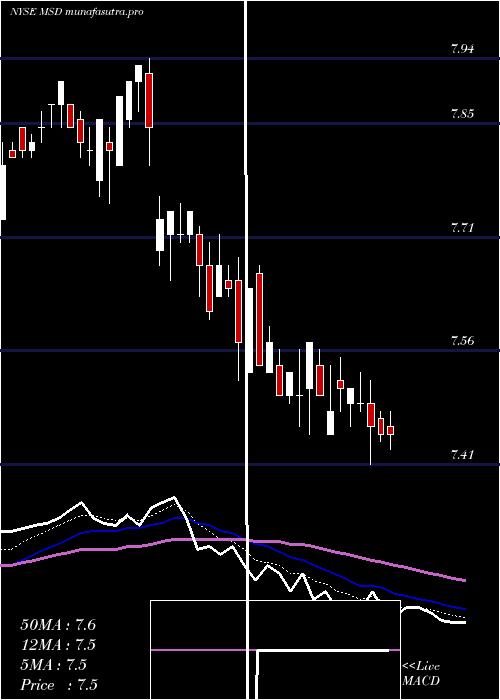
Daily price and charts and targets MorganStanley Strong Daily Stock price targets for MorganStanley MSD are 7.36 and 7.39 | Daily Target 1 | 7.35 | | Daily Target 2 | 7.36 | | Daily Target 3 | 7.38 | | Daily Target 4 | 7.39 | | Daily Target 5 | 7.41 |
Daily price and volume Morgan Stanley
| Date |
Closing |
Open |
Range |
Volume |
Fri 05 December 2025 |
7.37 (-0.41%) |
7.40 |
7.37 - 7.40 |
0.7602 times |
Thu 04 December 2025 |
7.40 (0.14%) |
7.41 |
7.39 - 7.41 |
1.0772 times |
Wed 03 December 2025 |
7.39 (0.14%) |
7.38 |
7.38 - 7.41 |
1.8297 times |
Tue 02 December 2025 |
7.38 (0.27%) |
7.38 |
7.36 - 7.40 |
0.9138 times |
Mon 01 December 2025 |
7.36 (-0.67%) |
7.35 |
7.35 - 7.39 |
0.5595 times |
Fri 28 November 2025 |
7.41 (0.68%) |
7.37 |
7.36 - 7.41 |
0.6988 times |
Wed 26 November 2025 |
7.36 (-0.14%) |
7.35 |
7.32 - 7.37 |
0.5178 times |
Tue 25 November 2025 |
7.37 (1.38%) |
7.30 |
7.29 - 7.38 |
1.3559 times |
Mon 24 November 2025 |
7.27 (0%) |
7.30 |
7.27 - 7.30 |
1.2604 times |
Fri 21 November 2025 |
7.27 (0.41%) |
7.26 |
7.25 - 7.29 |
1.0268 times |
Thu 20 November 2025 |
7.24 (-0.28%) |
7.29 |
7.24 - 7.29 |
1.2813 times |
Weekly price and charts MorganStanley Strong weekly Stock price targets for MorganStanley MSD are 7.36 and 7.42 | Weekly Target 1 | 7.32 | | Weekly Target 2 | 7.34 | | Weekly Target 3 | 7.3766666666667 | | Weekly Target 4 | 7.4 | | Weekly Target 5 | 7.44 |
Weekly price and volumes for Morgan Stanley
| Date |
Closing |
Open |
Range |
Volume |
Fri 05 December 2025 |
7.37 (-0.54%) |
7.35 |
7.35 - 7.41 |
1.0211 times |
Fri 28 November 2025 |
7.41 (1.93%) |
7.30 |
7.27 - 7.41 |
0.7614 times |
Fri 21 November 2025 |
7.27 (-0.14%) |
7.29 |
7.22 - 7.32 |
1.2262 times |
Fri 14 November 2025 |
7.28 (0.28%) |
7.30 |
7.25 - 7.34 |
1.0416 times |
Fri 07 November 2025 |
7.26 (-1.76%) |
7.35 |
7.24 - 7.40 |
1.1161 times |
Fri 31 October 2025 |
7.39 (0%) |
7.41 |
7.35 - 7.46 |
0.3402 times |
Fri 31 October 2025 |
7.39 (-0.54%) |
7.46 |
7.35 - 7.48 |
1.1212 times |
Fri 24 October 2025 |
7.43 (1.78%) |
7.30 |
7.26 - 7.51 |
0.9893 times |
Fri 17 October 2025 |
7.30 (0.83%) |
7.25 |
7.22 - 7.34 |
1.0848 times |
Fri 10 October 2025 |
7.24 (-2.03%) |
7.39 |
7.24 - 7.43 |
1.2981 times |
Fri 03 October 2025 |
7.39 (-1.6%) |
7.50 |
7.29 - 7.54 |
1.441 times |

Monthly price and charts MorganStanley Strong monthly Stock price targets for MorganStanley MSD are 7.36 and 7.42 | Monthly Target 1 | 7.32 | | Monthly Target 2 | 7.34 | | Monthly Target 3 | 7.3766666666667 | | Monthly Target 4 | 7.4 | | Monthly Target 5 | 7.44 |
Monthly price and volumes Morgan Stanley
| Date |
Closing |
Open |
Range |
Volume |
Fri 05 December 2025 |
7.37 (-0.54%) |
7.35 |
7.35 - 7.41 |
0.2645 times |
Fri 28 November 2025 |
7.41 (0.27%) |
7.35 |
7.22 - 7.41 |
1.0737 times |
Fri 31 October 2025 |
7.39 (0.27%) |
7.36 |
7.22 - 7.51 |
1.4321 times |
Tue 30 September 2025 |
7.37 (-1.99%) |
7.45 |
7.29 - 7.69 |
1.4307 times |
Fri 29 August 2025 |
7.52 (0.94%) |
7.46 |
7.39 - 7.54 |
1.195 times |
Thu 31 July 2025 |
7.45 (-3.62%) |
7.71 |
7.41 - 7.75 |
1.0333 times |
Mon 30 June 2025 |
7.73 (0.39%) |
7.70 |
7.67 - 7.94 |
0.688 times |
Fri 30 May 2025 |
7.70 (0.65%) |
7.70 |
7.42 - 7.73 |
0.8462 times |
Wed 30 April 2025 |
7.65 (-4.97%) |
8.04 |
6.91 - 8.10 |
1.1979 times |
Mon 31 March 2025 |
8.05 (-2.31%) |
8.24 |
7.84 - 8.32 |
0.8385 times |
Fri 28 February 2025 |
8.24 (2.74%) |
7.98 |
7.94 - 8.24 |
0.7517 times |

DMA SMA EMA moving averages of Morgan Stanley MSD
DMA (daily moving average) of Morgan Stanley MSD
| DMA period | DMA value | | 5 day DMA | 7.38 | | 12 day DMA | 7.34 | | 20 day DMA | 7.32 | | 35 day DMA | 7.35 | | 50 day DMA | 7.35 | | 100 day DMA | 7.42 | | 150 day DMA | 7.51 | | 200 day DMA | 7.59 | EMA (exponential moving average) of Morgan Stanley MSD
| EMA period | EMA current | EMA prev | EMA prev2 | | 5 day EMA | 7.38 | 7.38 | 7.37 | | 12 day EMA | 7.36 | 7.36 | 7.35 | | 20 day EMA | 7.35 | 7.35 | 7.34 | | 35 day EMA | 7.34 | 7.34 | 7.34 | | 50 day EMA | 7.37 | 7.37 | 7.37 |
SMA (simple moving average) of Morgan Stanley MSD
| SMA period | SMA current | SMA prev | SMA prev2 | | 5 day SMA | 7.38 | 7.39 | 7.38 | | 12 day SMA | 7.34 | 7.33 | 7.33 | | 20 day SMA | 7.32 | 7.32 | 7.31 | | 35 day SMA | 7.35 | 7.35 | 7.35 | | 50 day SMA | 7.35 | 7.35 | 7.36 | | 100 day SMA | 7.42 | 7.43 | 7.43 | | 150 day SMA | 7.51 | 7.52 | 7.52 | | 200 day SMA | 7.59 | 7.6 | 7.6 |
|
|
